EUR/USD

Higher timeframes
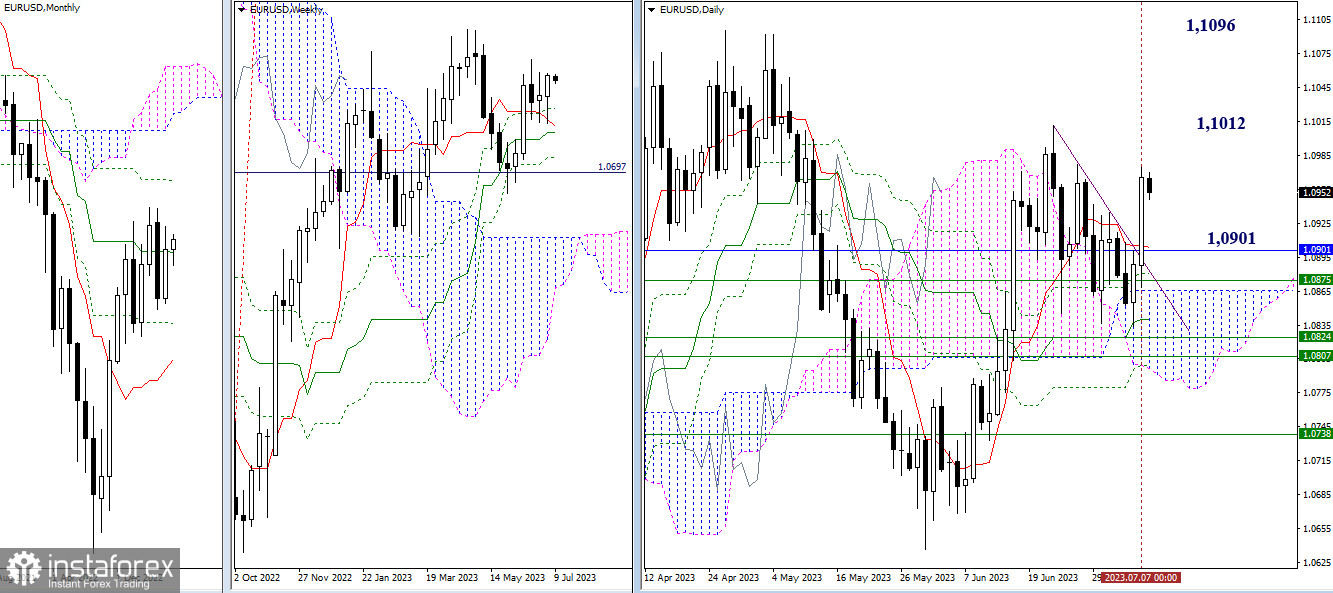
At the end of last week, buyers implemented confirmation of the rebound from the accumulation of supports, breaking the correction trendline. As a result, the nearest bullish targets are now at the highs of 1.1012 and 1.1096. The bearish targets maintained their value with the opening of the new week, and the support zone still retains an accumulation of various levels, spanning a wide front of 1.0901 - 1.0875 - 1.0866 - 1.0840 - 1.0724 - 1.0807 - 1.0799.

H4 - H1
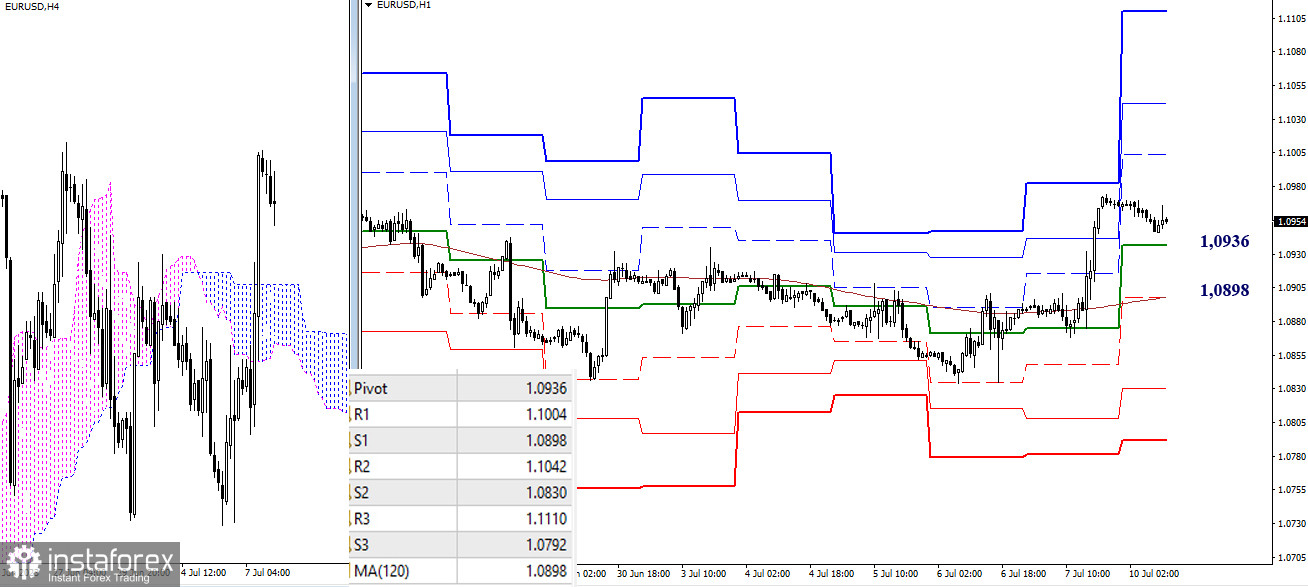
On the lower timeframes, the advantage belongs to the bulls. With the formation of new highs and continuation of the ascent, the resistance levels of the classic pivot points (1.1004 - 1.1042 - 1.1010) will serve as intraday targets. If the corrective decline persists, the most significant value will be the breakdown of key levels and a reliable consolidation below them. This could change the current balance of power and bring back bearish sentiments to the market. The key levels on lower timeframes today are located at 1.0936 (central pivot point of the day) and 1.0998 (weekly long-term trend).
***
GBP/USD

Higher timeframes
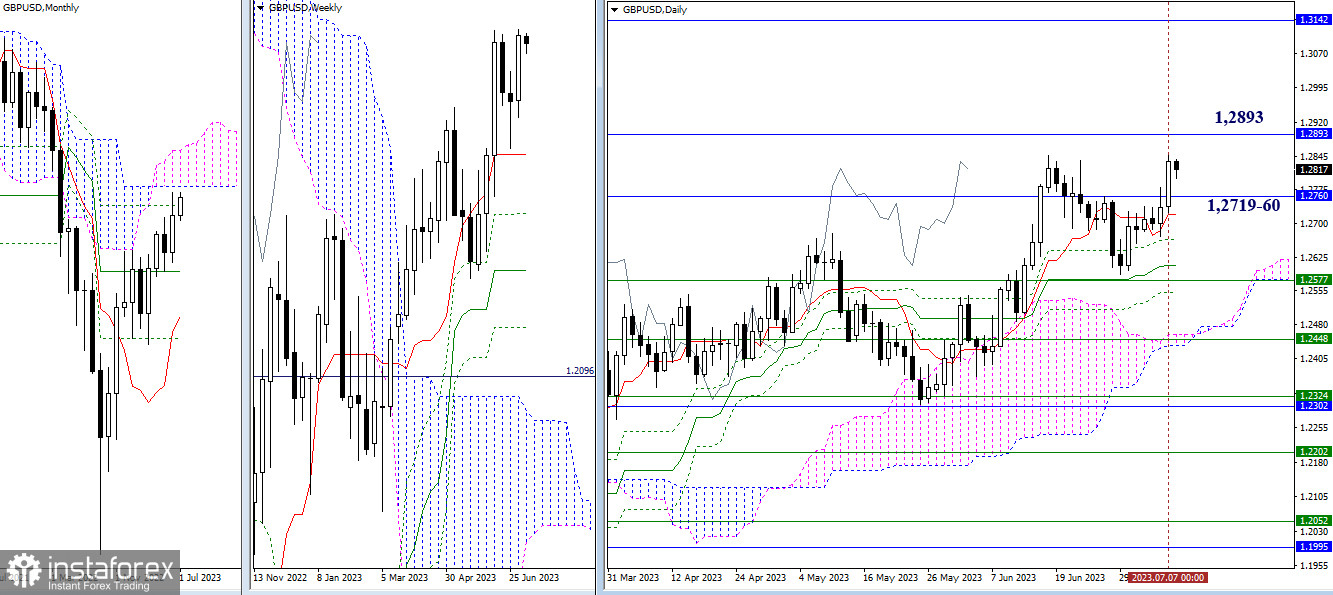
On Friday, bullish players continued their ascent and reached a June high (1.2847). This has laid the groundwork for further strengthening of bullish sentiment. The prospects for the upward movement in the current situation encounter resistance from the monthly Ichimoku cloud, with its boundaries currently at 1.2893 - 1.3142. It is also worth noting that another monthly level (1.2760) exerts its influence on the market, forming the nearest support zone together with the daily short-term trend (1.2719).

H4 - H1
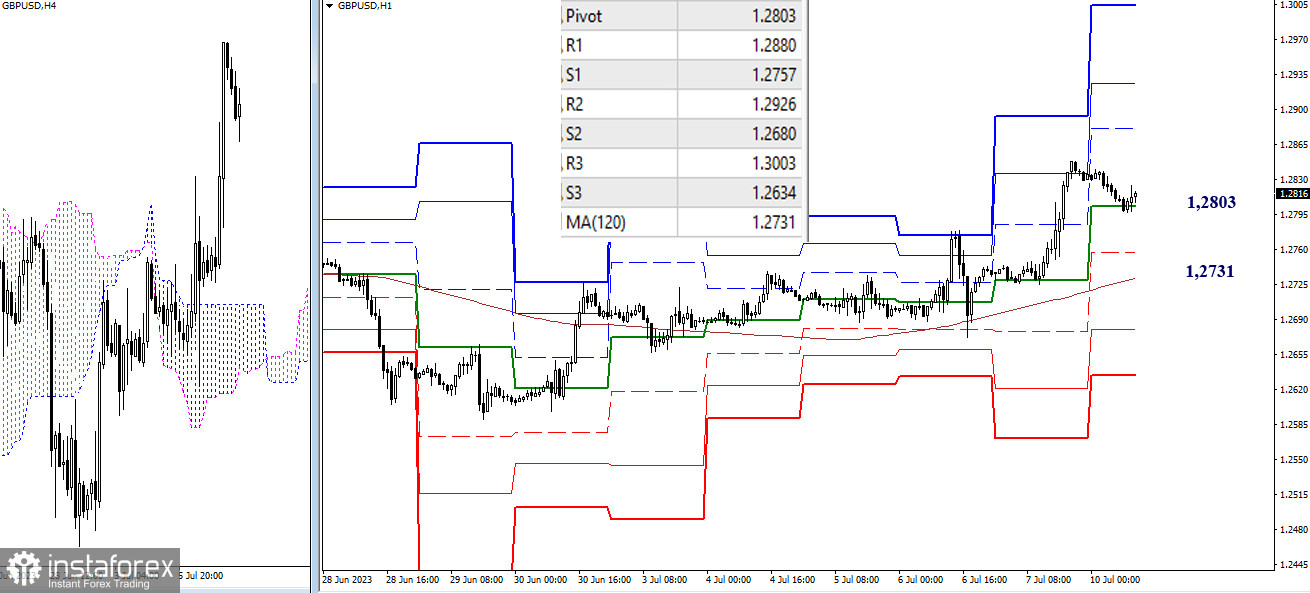
After reaching a new high on lower timeframes, a downward correction is forming and developing. Bears have descended to test the support of the central pivot point (1.2803) and are testing its strength. Next, they will encounter the most important support—the weekly long-term trend (1.2731), which determines the current balance of power on lower timeframes. A break and reversal of the moving average will contribute to the transformation of the correction into a trend movement, thereby strengthening the possibilities for bearish players. Intermediate support may come from 1.2757 (S1 of the classic pivot points), and further intraday targets in case of a break of the weekly long-term trend will be S2 (1.2680) and S3 (1.2634) of the classic pivot points.
***
The technical analysis of the situation uses:
Higher timeframes - Ichimoku Kinko Hyo (9.26.52) + Fibo Kijun levels
Lower timeframes - H1 - Pivot Points (classic) + Moving Average 120 (weekly long-term trend)
 English
 Русский
 Bahasa Indonesia
 Bahasa Malay
 ไทย
ไทย Español
 Deutsch
 Български
 Français
 Tiếng Việt
 中文
中文 বাংলা
বাংলা हिन्दी
 Čeština
 Українська
 Română

