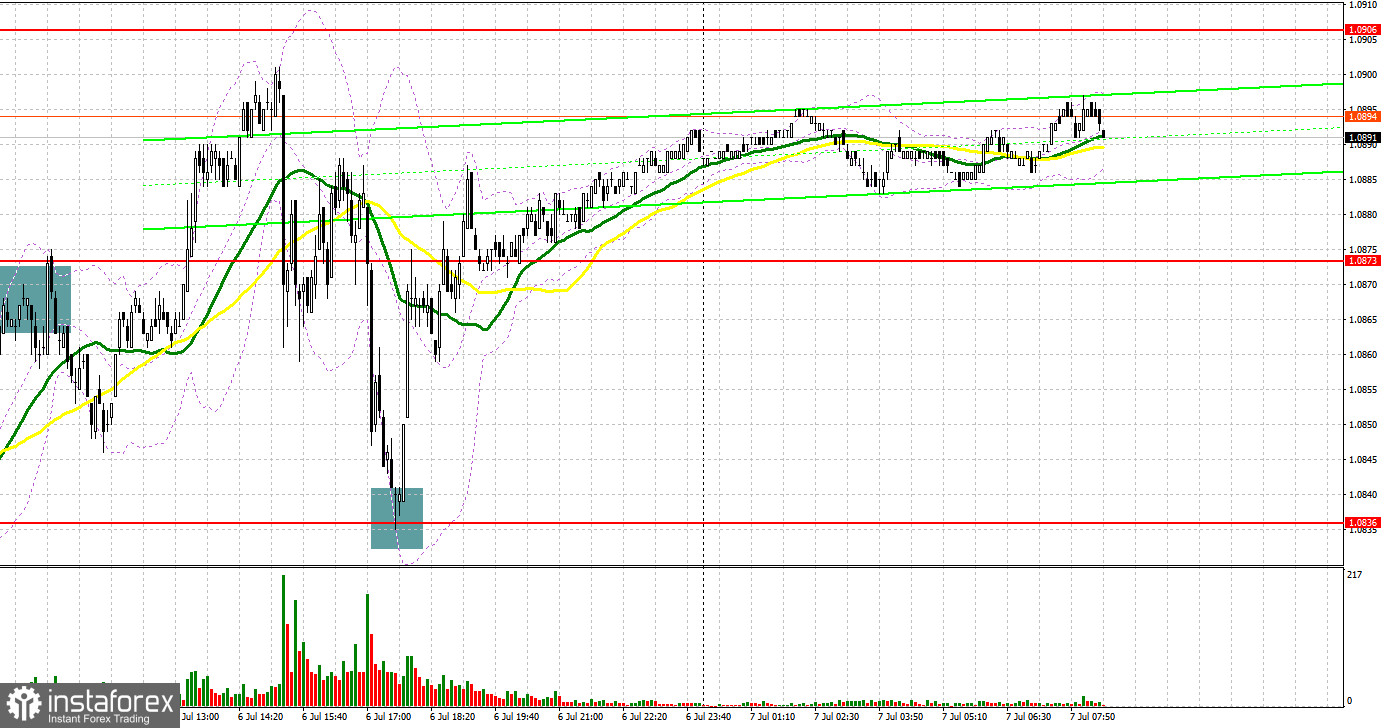
Yesterday, the pair formed several entry signals. Let's have a look at the 5-minute chart and see what happened here. In my morning review, I mentioned the level of 1.0863 as a possible entry point. A rise to this level and its false breakout generated a sell signal resulting in a slide of more than 30 pips. The ADP employment data caused a sharp fall in the euro. The entry point for long positions appeared only at the level of 1.0836 which eventually brought 50 pips in profit.

For long positions on EUR/USD
The US jobs report from ADP and a strong services PMI once again confirmed the resilience of the US economy even amid high interest rates. This data will definitely impact the future policy of the Federal Reserve. We will discuss the report on nonfarm payrolls in the second half of the day. During the European session, markets may take notice of France's trade balance and changes in Italy's retail trade volume, which are not of great interest. The speeches by ECB Vice President Luis de Guindos and ECB Executive Board member Joachim Nagel will be of more importance to the markets. On top of that, ECB President Christine Lagarde will give a speech in the middle of the New York session.
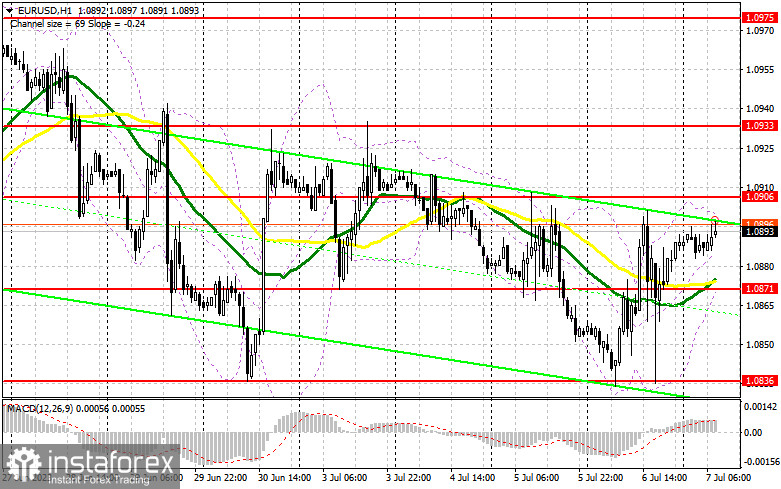
It is better to enter the market in the first half of the day after a decline and a false breakout of the 1.0871 support level where the moving averages play on the side of the bulls. This will generate a buy signal that can potentially send the pair back to the resistance at 1.0906. This is a key level as its retest may stop the bearish pressure. Only hawkish comments by ECB representatives and positive data from the eurozone will enable the price to break out of this range. A breakout and a downward test of 1.0906 will strengthen demand for the euro, giving it a chance to return to the high of 1.0933. The ultimate target remains the area at 1.0975 where I will take profit. If EUR/USD declines and there are no buyers at 1.0871, pressure on EUR/USD will increase ahead of important US reports. Therefore, only the formation of a false breakout near the next support level at 1.0836, from which the price has already rebounded several times this week, will provide a signal to buy the euro. I will open long positions immediately on a rebound from the low of 1.0808, keeping in mind an upside correction of 30-35 pips within the day.
For short positions on EUR/USD
Yesterday, bears made several attempts to take control of the market but the euro quickly rebounded after each major decline. Today, I will enter the market only after a false breakout at 1.0906, which will serve as a sell signal with a potential decline towards support at 1.0871. Consolidation below this range, as well as its upward retest, will pave the way to 1.0836. This is a weekly low from where the sellers have already retreated several times. The ultimate target will be the area at 1.0808 where I will take profit. Its test will indicate the formation of a new bearish market.

In the event of upward movement in EUR/USD during the European session and the absence of bears at 1.0906, which is possible amid US jobs market uncertainty, bulls will attempt to restore the market balance. In that case, I will postpone short positions until the price hits the next resistance at 1.0933. Selling is possible at this level but only after a failed consolidation. I will open short positions immediately on a rebound from the high of 1.0975, with a target of 30-35 pips in a downward correction.
COT report
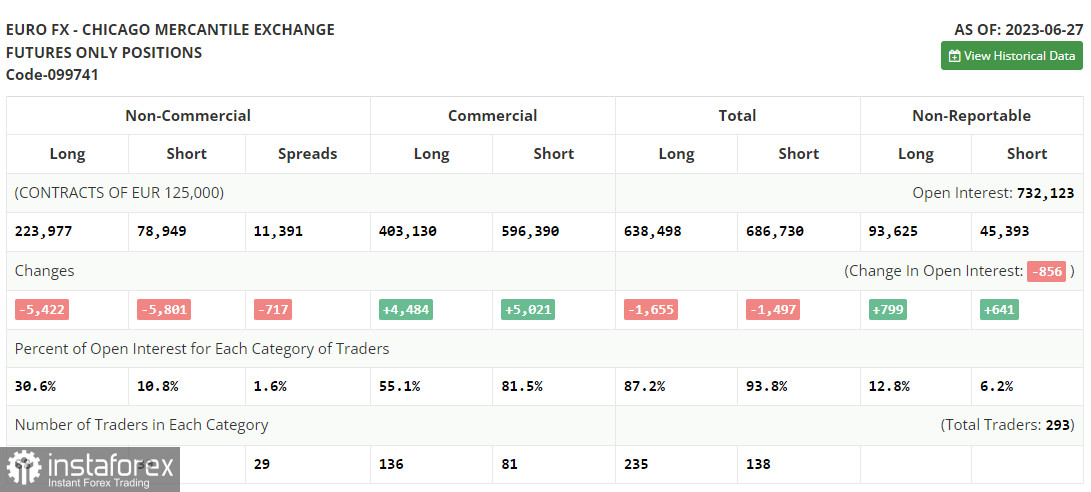
The COT report for June 27 showed a reduction in both long and short positions, leaving the market's balance practically unchanged. The GDP data released last week once again confirmed the resilience of the American economy even in the face of high interest rates, allowing the Federal Reserve to actively combat high inflation which is gradually returning to normal. In the near future, the minutes of the Fed's meeting will be released, and we will also learn about the state of the US labor market, which may strengthen the US dollar against the euro. In the current conditions, buying on pullbacks remains the optimal medium-term strategy. The COT report indicates that long positions of the non-commercial group of traders decreased by 5,422 to 223,977 while short positions fell by 5,801 to 78,949. At the end of the week, the overall non-commercial net position increased slightly to 145,028 compared to 144,025. The weekly closing price went up to 1.1006 from 1.0968.

Indicator signals:
Moving Averages
Trading above the 30- and 50-day moving averages indicates a bullish attempt to return to the market.
Please note that the time period and levels of the moving averages are analyzed only for the H1 chart, which differs from the general definition of the classic daily moving averages on the D1 chart.
Bollinger Bands
In case of a decline, the lower band of the indicator at 1.0871 will act as support.
Description of indicators:
• A moving average of a 50-day period determines the current trend by smoothing volatility and noise; marked in yellow on the chart;
• A moving average of a 30-day period determines the current trend by smoothing volatility and noise; marked in green on the chart;
• MACD Indicator (Moving Average Convergence/Divergence) Fast EMA with a 12-day period; Slow EMA with a 26-day period. SMA with a 9-day period;
• Bollinger Bands: 20-day period;
• Non-commercial traders are speculators such as individual traders, hedge funds, and large institutions who use the futures market for speculative purposes and meet certain requirements;
• Long non-commercial positions represent the total number of long positions opened by non-commercial traders;
• Short non-commercial positions represent the total number of short positions opened by non-commercial traders;
• The non-commercial net position is the difference between short and long positions of non-commercial traders.
 English
 Русский
 Bahasa Indonesia
 Bahasa Malay
 ไทย
ไทย Español
 Deutsch
 Български
 Français
 Tiếng Việt
 中文
中文 বাংলা
বাংলা हिन्दी
 Čeština
 Українська
 Română

