Analyzing Thursday's trades:
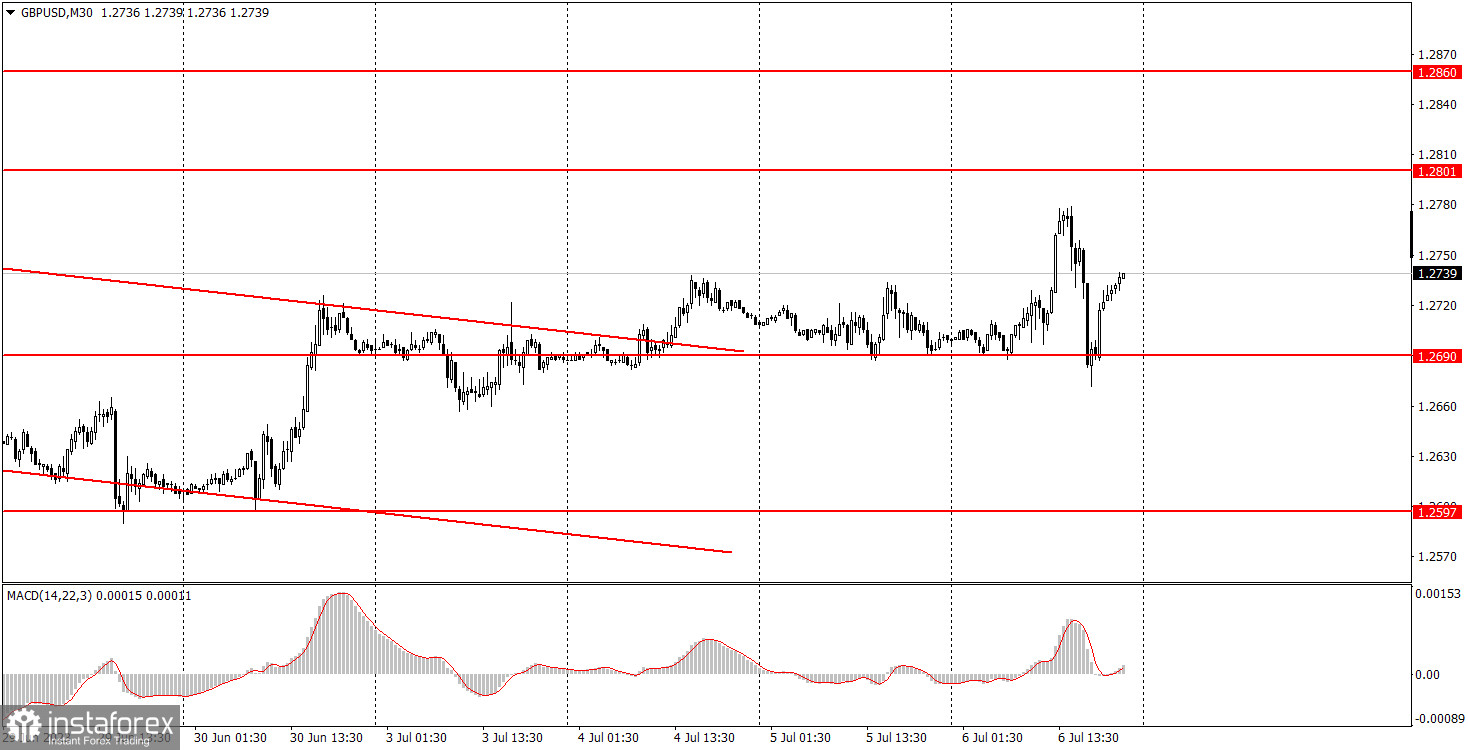
GBP/USD on 30M chart

The GBP/USD pair showed mixed movements on Thursday due to a strong and varied macroeconomic background. During the European trading session, the UK released its Construction PMI, which revealed a notable miss as activity moves back into contraction territory. Buyers did not mind and still actively bought the pound.
In the second half of the day in the US, four important reports were released. If the unemployment benefit claims data was neutral, then the ISM index in the services sector significantly exceeded forecasts. The number of JOLTs job openings was slightly worse than expected, but the ADP released another super strong job, noting private sector employment growth of 497,000 in June, more than double expectations. Therefore, in the second half of the day, the dollar grew, but fell again towards the evening. As we mentioned earlier, the dollar can strengthen locally, but in the medium term, it is extremely difficult for it to trade higher against the pound. After the quotes came out of the downward channel, an uptrend was formed, which is currently being worked out.
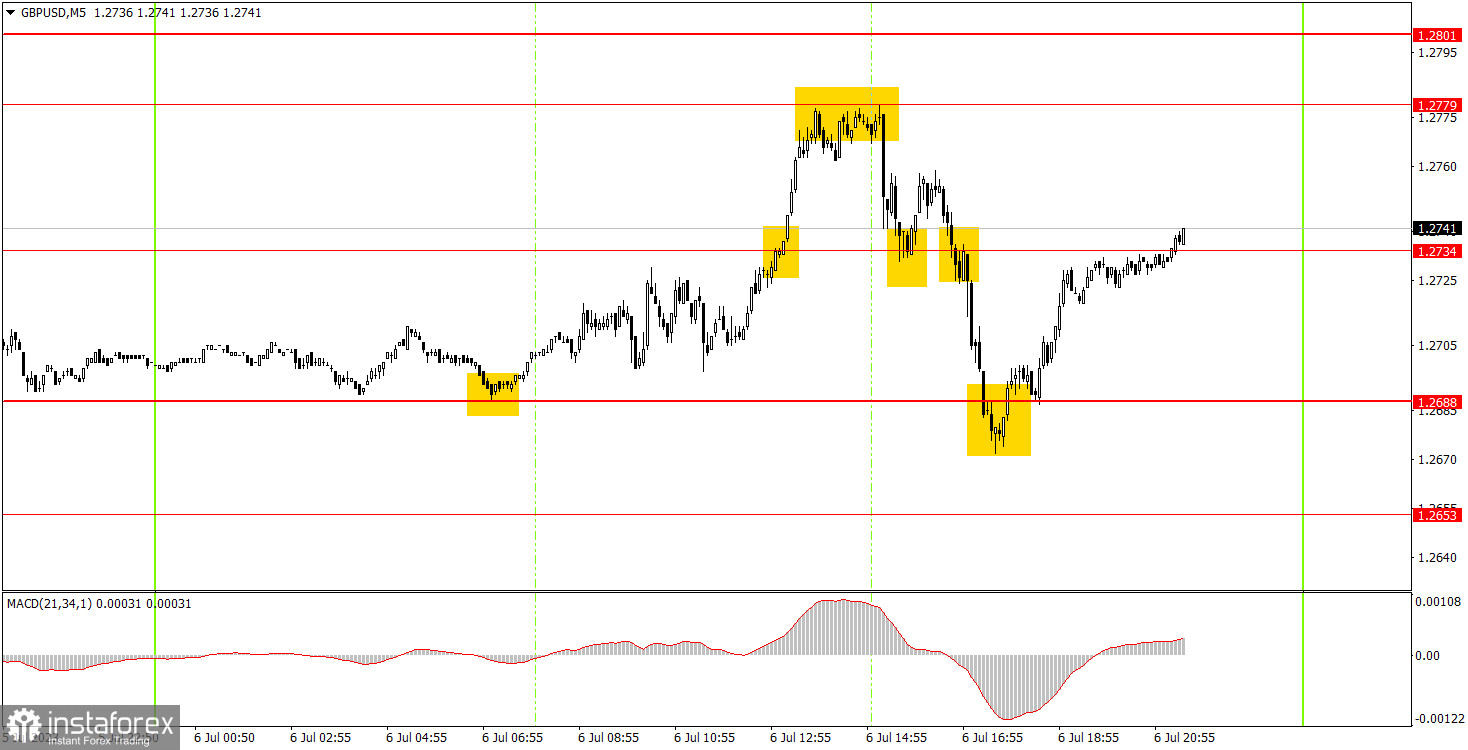
GBP/USD on 5M chart

Although the movements were not exactly strong, the pair still managed to pass 100 points. And in both directions, no less. Take note that 100 points for the pound sterling is not a lot. As in the case of the euro, it was quite safe to trade the pair in the first half of the day. Some levels have changed on Wednesday and Thursday. The first buy signal formed early in the morning around the 1.2688 level, and then the pair reached 1.2779, which is a new level.
But beginners should have closed the long positions in that area anyway, as important reports were to be released at the very beginning of the US session and the market sentiment could change. This is what happened. Despite the strong movement in the second half of the day, it was quite difficult to predict it. Or rather, it was hard to react to it in time. Therefore, the next signal to execute is a bounce off the 1.2688 level, as early in the morning. You could have earned about 90 points on these two deals. The main thing was not to enter the market during the release of important US macro data.
Trading tips on Friday:
As seen on the 30M chart, the pair has broken the downtrend, which isn't surprising. The pound manages to rise even on days when there is no fundamental background. Therefore, for purely technical reasons, the pound can continue to rise this week, but much will depend on the macroeconomic background from America. However, with the current market sentiment, this may not even prevent the pound from extending upward movement. The key levels on the 5M chart are 1.2457, 1.2499, 1.2538, 1.2597-1.2605, 1.2653, 1.2688, 1.2734, 1.2779, 1.2801, 1.2860, 1.2913, 1.2981. When the price moves 20 pips in the right direction after opening a trade, a stop loss can be set at breakeven. No important events lined up for Friday in the UK. But we have the US Non-farms and unemployment data to look forward to. Volatility may probably turn out the same as Thursday. We might even witness sharp price reversals during the US session.
Basic trading rules:
1) The strength of the signal depends on the time period during which the signal was formed (a rebound or a break). The shorter this period, the stronger the signal.
2) If two or more trades were opened at some level following false signals, i.e. those signals that did not lead the price to Take Profit level or the nearest target levels, then any consequent signals near this level should be ignored.
3) During the flat trend, any currency pair may form a lot of false signals or do not produce any signals at all. In any case, the flat trend is not the best condition for trading.
4) Trades are opened in the time period between the beginning of the European session and until the middle of the American one when all deals should be closed manually.
5) We can pay attention to the MACD signals in the 30M time frame only if there is good volatility and a definite trend confirmed by a trend line or a trend channel.
6) If two key levels are too close to each other (about 5-15 pips), then this is a support or resistance area.
How to read charts:
Support and Resistance price levels can serve as targets when buying or selling. You can place Take Profit levels near them.
Red lines are channels or trend lines that display the current trend and show which direction is better to trade.
MACD indicator (14,22,3) is a histogram and a signal line showing when it is better to enter the market when they cross. This indicator is better to be used in combination with trend channels or trend lines.
Important speeches and reports that are always reflected in the economic calendars can greatly influence the movement of a currency pair. Therefore, during such events, it is recommended to trade as carefully as possible or exit the market in order to avoid a sharp price reversal against the previous movement.
Beginners should remember that every trade cannot be profitable. The development of a reliable strategy and money management are the key to success in trading over a long period of time.
 English
 Русский
 Bahasa Indonesia
 Bahasa Malay
 ไทย
ไทย Español
 Deutsch
 Български
 Français
 Tiếng Việt
 中文
中文 বাংলা
বাংলা हिन्दी
 Čeština
 Українська
 Română

