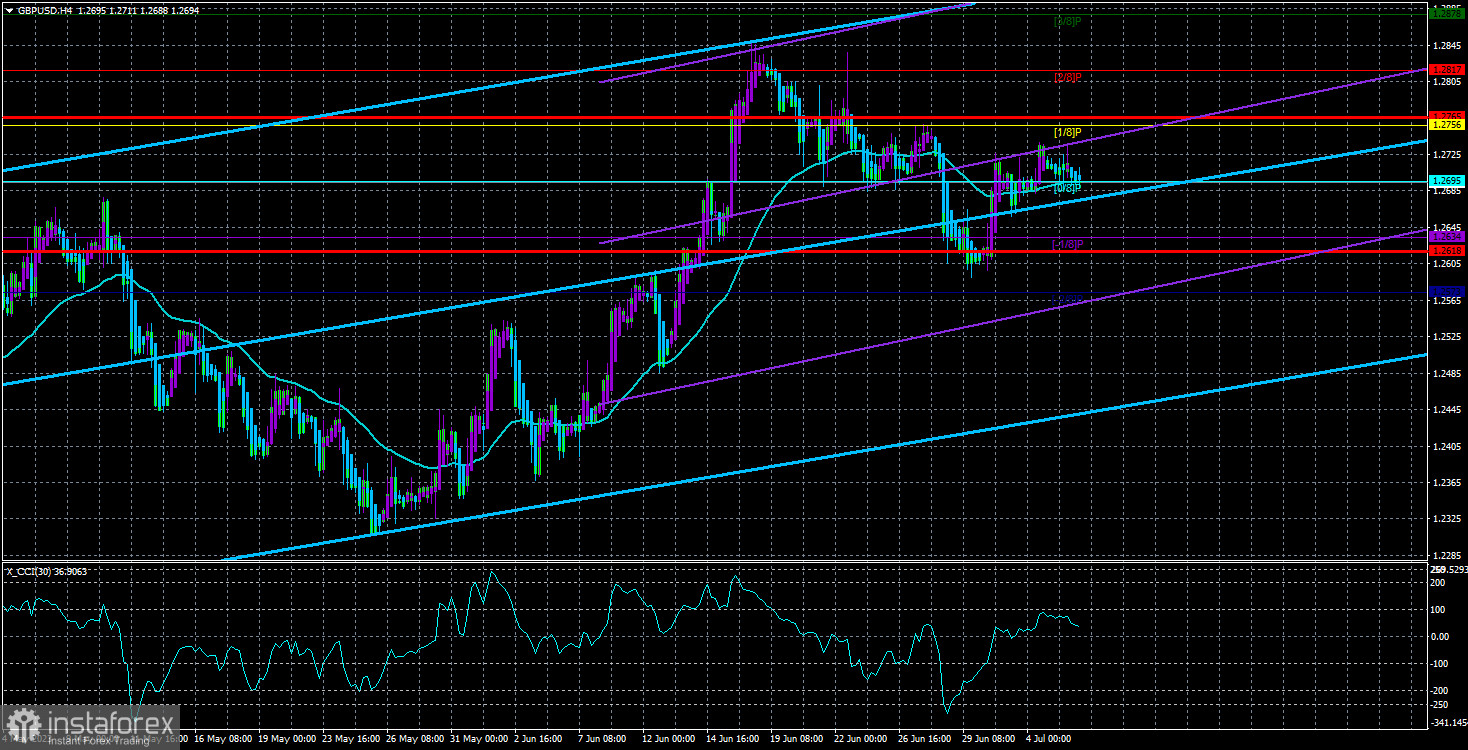
GBP/USD showed minimal volatility and was slightly above the Moving Average on Wednesday. So far, new upward momentum seems unconvincing. Throughout the current week, the pair has been trading reluctantly, as if doing a favor. However, there were hardly any significant reports or events during the previous three weeks. The UK saw the release of the second estimate for business activity in the service and manufacturing sectors, which came almost in line with the first flash estimate. In the United States, manufacturing business activity indexes came worse than forecasts. Therefore, a minor decline in the dollar seemed reasonable. The dollar, in general, tends to fall more often against the pound than to rise.
The difference between GBP/USD and EUR/USD is evident. The Bank of England's interest rate is higher than the ECB's, which explains why the British pound is stronger. However, the pound has been rising for 10 months, gaining 2,500 points, and cannot enter a proper bullish correction. The Bank of England will stop hiking rates one day. Moreover, the British economy is much weaker than the American one. As we can see, there are sufficient reasons for a stronger dollar, but the market, being in a flat phase, pays little attention to those facts.
In the 24-hour time frame, the pair is in an uptrend. It cannot consolidate even below the critical line, although it is very close to it. Quotes have been bullish since March 7, with a maximum correction of 350 pips. However, we believe that the upward momentum is getting weaker. The Bank of England may raise the interest rate two more times, and the market is already aware of this. Currently, there are no intraday signals indicating a trend reversal. Therefore, selling the pair is now a bad idea.
ISM data and jobless claims statistics
Today, traders will focus on the following four reports: the ISM index, jobless claims, and job openings. Taking into account an almost uninterrupted rise in the British pound, the dollar will unlikely show strong growth even if these reports come upbeat. However, the greenback is still capable of strengthening within one day. Furthermore, with each new driver, a bearish trend will seem more likely to begin. That is why US statistics on Thursday and Friday are crucial.
Traders should also pay attention to the ISM index and job openings data. The ISM services PMI has seen a significant decline over the past three months, but it has not dropped below line 50 yet. It could potentially fall below this level by the end of June, which will undoubtedly trigger a decline in the dollar.
On the other hand, labor market data and unemployment claims may support the dollar. The number of job openings in the labor market increased in April, which allows us to expect growth in May as well. In any case, the labor market is resilient in the face of tight monetary policy. The same applies to jobless claims. Last week, this report exceeded expectations, and overall unemployment remained near its 50-year low.
Thus, the dollar can equally show both growth and decline today. Speculating on the direction of the currency pair is pointless since no one can predict the outcome of the reports. If we consider the overall trend, it is more likely that the pair will continue to rise. However, the pound has increased by 60-70% for no reason, while the euro has been consolidating over the past six months.

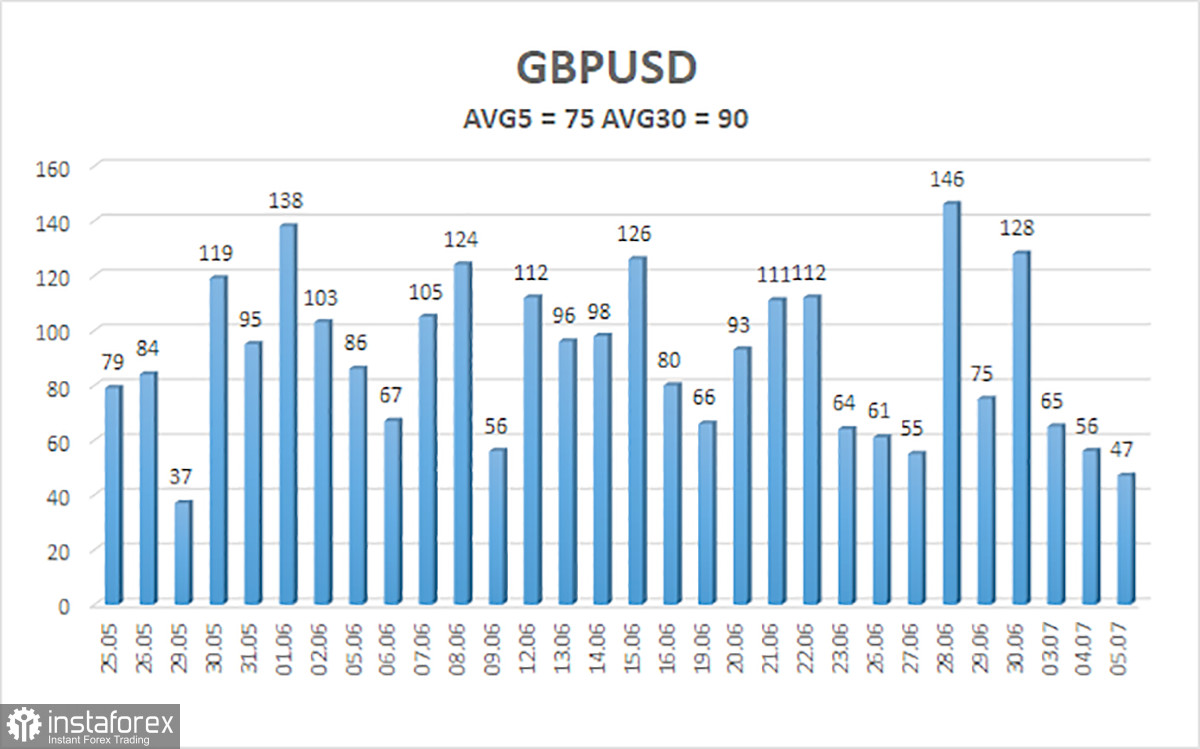
The 5-day average volatility of GBP/USD totals 75 pips on July 6 and is considered moderate. The price will likely be in the range between 1.2618 and 1.2765 on Thursday. Heikin Ashi's reversal to the upside will indicate bullish momentum.
Support:
S1 – 1.2695
S2 – 1.2634
S3 – 1.2573
Resistance:
R1 – 1.2756
R2 – 1.2817
R3 – 1.2878
Outlook:
GBP/USD is above the Moving Average n the 4-hour chart. Therefore, we can buy with targets at 1.2756 and 1.2765 when the price bounces from the Moving Average or Heikin-Ashi reverses to the upside. If the price consolidates below the Moving Average, we can consider selling with targets at 1.2634 and 1.2618.
Indicators on charts:
Linear Regression Channels help identify the current trend. If both channels move in the same direction, a trend is strong.
Moving Average (20-day, smoothed) defines the short-term and current trends.
Murray levels are target levels for trends and corrections.
Volatility levels (red lines) reflect a possible price channel the pair is likely to trade in within the day based on the current volatility indicators.
CCI indicator. When the indicator is in the oversold zone (below 250) or in the overbought area (above 250), it means that a trend reversal is likely to occur soon.
 English
 Русский
 Bahasa Indonesia
 Bahasa Malay
 ไทย
ไทย Español
 Deutsch
 Български
 Français
 Tiếng Việt
 中文
中文 বাংলা
বাংলা हिन्दी
 Čeština
 Українська
 Română

