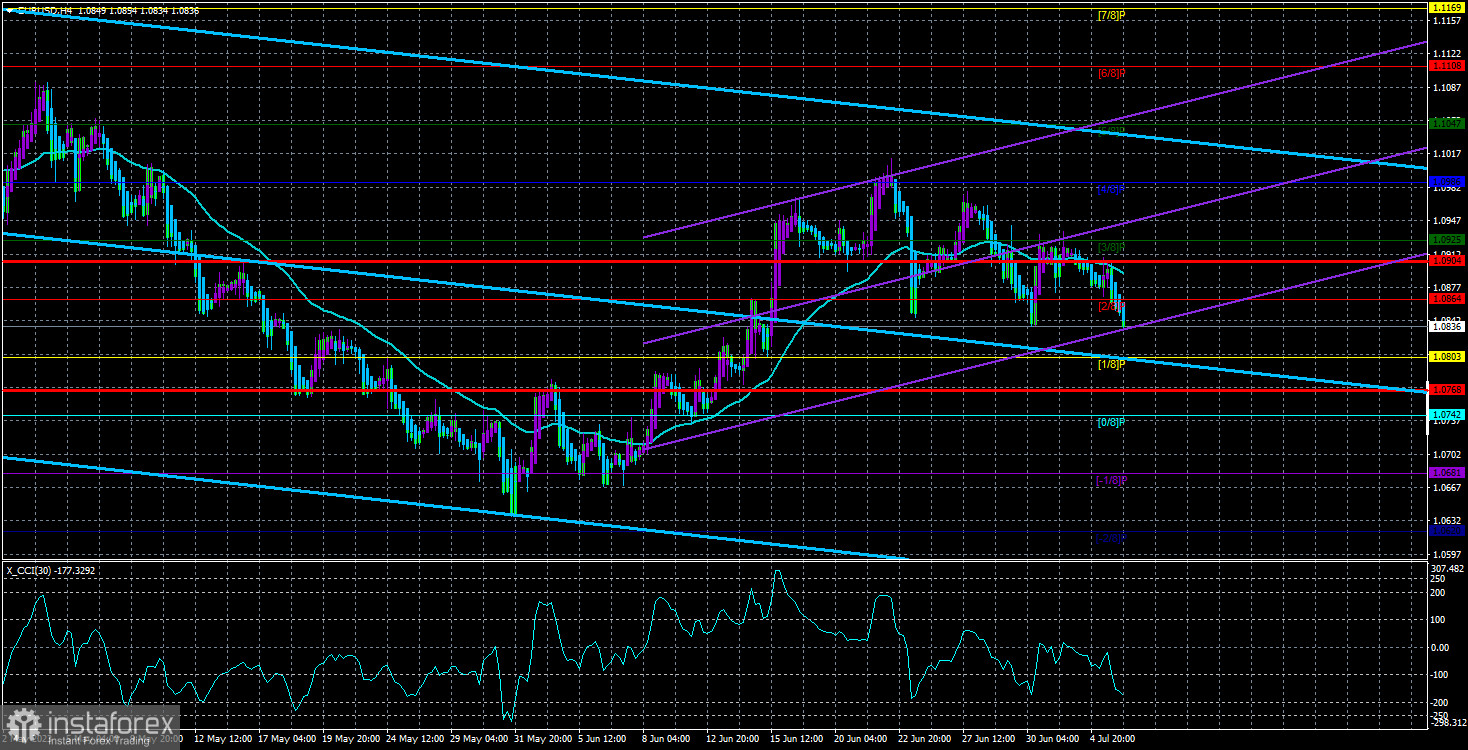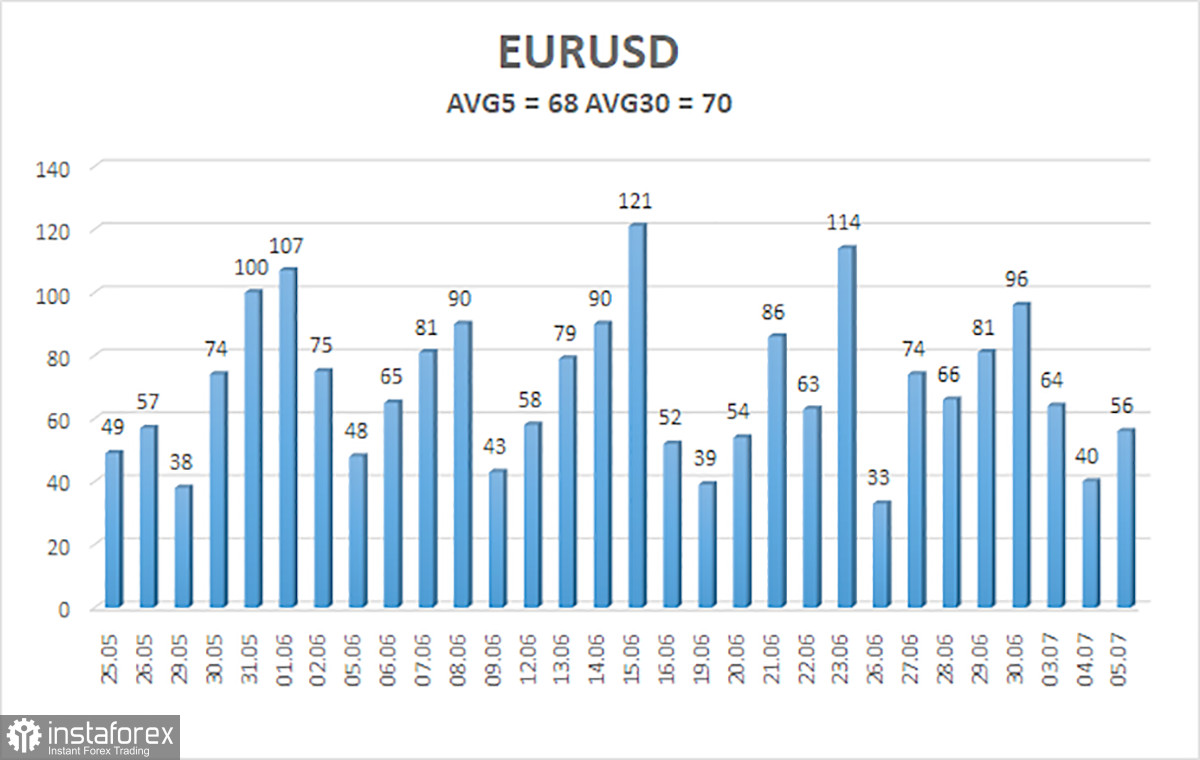
EUR/USD started a new downward movement on Wednesday, which looks like a trend on the chart. The pair has settled below the Moving Average trice now, indicating selling pressure. Quotes continue reaching new lows, which suggests that the pair is in a downtrend at the moment. However, we would like to draw traders' attention to another important fact - low volatility. According to the chart, the 5-day average volatility of EUR/USD totals 70 pips. It may seem enough, but the pair does not move by 70 pips every day. In practice, it looks like this: three days with volatility of 40-50 pips, and two days with volatility of 80-90 pips. On days when volatility reaches 100 pips, trading is quite feasible. On days when it does not exceed 60 pips, intraday trading becomes very challenging.
This week, average volatility has been around 55 pips, which allows us to hold positions for at least a few days and expect a substantial profit. However, the pair has recently been in a flat phase. Despite a bearish bias, the price is not in a hurry to go down. All of the above should be taken into account when opening positions.
The technical picture will likely change on Thursday and Friday. Today, the United States will see the release of at least four important reports. Should they come in line with forecasts, there would hardly be a market reaction. However, results often miss expectations, so we can anticipate a stronger movement today.
In the 24-hour time frame, we have a bearish reversal. Quotes are still within the consolidation range of 1.05-1.11. Therefore, the pair will highly likely go down. The Ichimoku lines currently lack strength. That is why a breakout through them will not indicate a new downtrend. However, the pair may reach the level of 1.0500.
Not all FOMC members favored a pause in tightening.
The release of FOMC Minutes is often just a formality. Yesterday's report, which could be considered moderately resonant, did not provoke any market reaction (or a very weak one), judging by the volatility of both major currency pairs. Nevertheless, the latest Minutes revealed that not all members of the Federal Reserve's Monetary Committee favored a pause in June. However, disagreements within the Committee should not surprise or shock traders because Jerome Powell and his team's overall plan is clear and precise. The interest rate will be raised once every two meetings. So, we can expect two more rate hikes in total. It does not matter whether any committee member disagrees with the general consensus because the majority of officials adhere to the common plan.
It also became known that the majority of policymakers advocated for further tightening in 2023. Sentiment is clearly getting more hawkish on the back of strong GDP data over the past three quarters as well as a robust labor market and unemployment rate. The Federal Reserve has room for a tightening continuation to bring inflation back to 2% shortly. Why not take advantage of the situation when the state of the economy allows that?
However, this information no longer holds much significance for the US dollar. The Fed's interest rate has been rising over the past 10 months, while the US dollar has been steadily declining over the same period. Therefore, one or two additional rate hikes will hardly change anything. We believe that the US dollar can strengthen in the coming weeks based solely on the consolidation channel, with its lower limit around the 1.05 level. Neither a fundamental nor macroeconomic backdrop is needed for that.

The 5-day average volatility of EUR/USD totals 68 pips on July 6 and is considered moderate. The price will likely be in the range between 1.0828 and 1.0982 on Thursday. Heikin Ashi's reversal to the upside will indicate bullish momentum.
Support:
S1 – 1.0803
S2 – 1.0742
S3 – 1.0681
Resistance:
R1 – 1.0864
R2 – 1.0925
R3 – 1.0986
Outlook:
EUR/USD has been in a flat phase since the beginning of the week. Therefore, we can sell with targets at 1.0803 and 1.0768 until Heikin-Ashi's reversal to the upside. Once the price consolidates above the Murray 3/8 at 1.0925, we can consider buying with the target at 1.0986.
Indicators on charts:
Linear Regression Channels help identify the current trend. If both channels move in the same direction, a trend is strong.
Moving Average (20-day, smoothed) defines the short-term and current trends.
Murray levels are target levels for trends and corrections.
Volatility levels (red lines) reflect a possible price channel the pair is likely to trade in within the day based on the current volatility indicators.
CCI indicator. When the indicator is in the oversold zone (below 250) or in the overbought area (above 250), it means that a trend reversal is likely to occur soon.
 English
 Русский
 Bahasa Indonesia
 Bahasa Malay
 ไทย
ไทย Español
 Deutsch
 Български
 Français
 Tiếng Việt
 中文
中文 বাংলা
বাংলা हिन्दी
 Čeština
 Українська
 Română

