EUR/USD
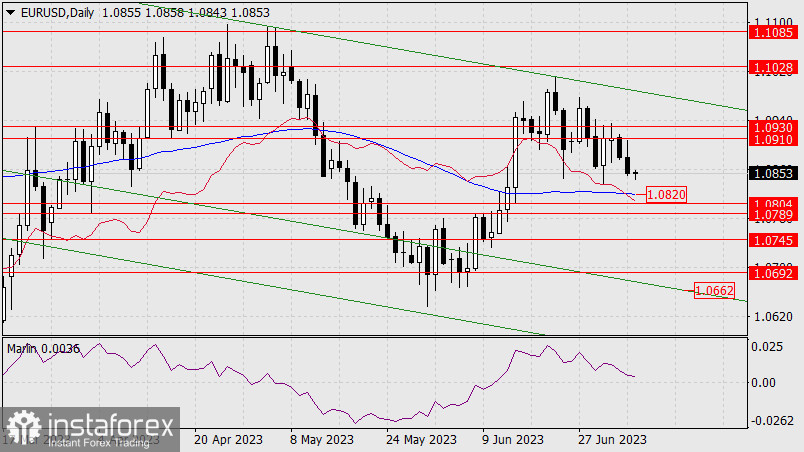
On Wednesday, the EUR/USD pair tested the resistance level of 1.0910 from below for the last time and fell, closing the day with a black candlestick of 25 points. Now the price is approaching the first support level on the daily chart at 1.0820 – to the MACD indicator line. Surpassing this line will pave the way for the price to reach the target range of 1.0789-1.0804. Trading in this range will mean that the price is ready for a medium-term decline (target 1.0662).

The Marlin oscillator is slowly falling, which, on the one hand, is good for a medium-term bearish perspective, because there will be a deep margin, but on the other hand, it is bad for this trend because the oscillator can turn into an upward correction from the zero line at the time when the price either touches the indicator line or the price range.

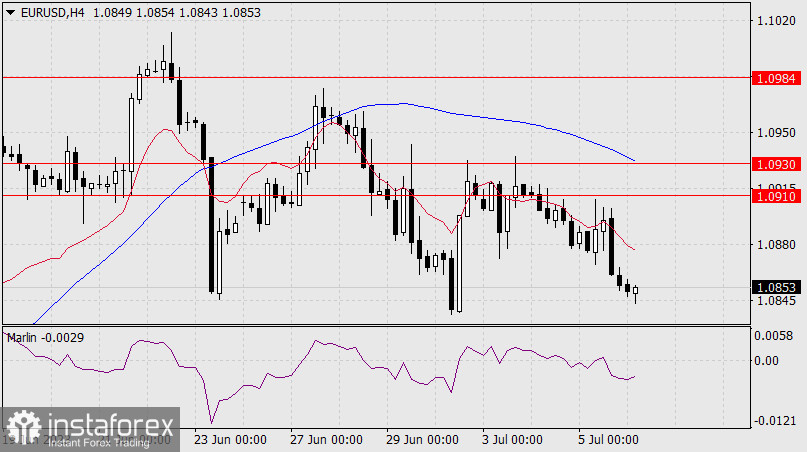
On the four-hour chart, the trend is entirely downward with no signs of reversal; the price is falling under both indicator lines, both these indicator lines are directed downwards, the Marlin oscillator is directed downwards in the downtrend territory.
 English
 Русский
 Bahasa Indonesia
 Bahasa Malay
 ไทย
ไทย Español
 Deutsch
 Български
 Français
 Tiếng Việt
 中文
中文 বাংলা
বাংলা हिन्दी
 Čeština
 Українська
 Română

