 English
  Русский
 Bahasa Indonesia
 Bahasa Malay
 ไทย
ไทย Español
 Deutsch
 Български
 Français
 Tiếng Việt
 中文
中文 বাংলা
বাংলা हिन्दी
 Čeština
 Українська
 Română

GBP/USD traded relatively sluggishly on Monday, with volatility of just over 60 pips. The price spent most of the day near a sideways Moving Average. Thus, we saw a typical flat market at the beginning of the week, which is likely to continue today as it is Independence Day in the United States. In recent weeks, we have repeatedly mentioned that the pound is too high against the dollar and should enter a significant correction equal to its previous growth. However, nothing seems to be changing over time. The pound remains heavily overbought, and the market continues to move in one direction. Even recent downward momentum cannot be considered the beginning of a new downtrend yet. It is evident that the market is anticipating an even stronger interest rate hike from the Bank of England, as there are simply no other reasons to buy the pound.
We have also repeatedly mentioned that tightening in the United Kingdom is a significant factor supporting the British currency. However, the pound has already risen by 2,500 pips. Even if the BOE raises the interest rate to 5.5%, it is unlikely to bring inflation back to 2%. So, what will the British regulator do then? The interest rate in the United States stands at 5.25%, while inflation has decreased from 8% to 4%. In the United Kingdom, the interest rate is at 5%, and inflation has decreased from 11.1% to 8.7%. The difference is obvious. It is clear that the interest rate needs to be raised by at least another 2% in order to expect inflation to return to the target level within several years. Even in the United States, they do not anticipate inflation returning to 2% in the near future.
Therefore, the Bank of England may raise the interest rate 2 or 3 times more, but it will not save the situation. Sooner or later, the British economy will enter a recession, and the regulator will be forced to stop tightening. We still believe that the situation in the United Kingdom is highly unfavorable and that the pound is growing without any reason for that.
Despite the macroeconomic reports released on Monday in both the US and the UK, the market is clearly awaiting more important information. This week, we will see a whole series of US labor market reports, including unemployment, wages, and the ISM index for the services sector. With business activity declining in all developed countries, it is unlikely that the dollar will find support from the ISM index. However, the labor market continues to show strong results month after month, so additional support for the US currency may come from that.
However, in our view, the technical picture is unlikely to be significantly influenced by all the reports of the current week. Market sentiment is now of greater importance. The market has been buying the pound for the past 10 months. With this in mind, what is the likelihood of a downward reversal after one or two strong reports from the US? Moreover, NonFarm Payrolls and unemployment data have been upbeat for months, but a strengthening of the US dollar has not begun yet.
Therefore, we believe that the pound may enter a minor downward correction now. We also anticipate that the 10-month upward trend will come to an end in the near future, but technical signals are needed to confirm this, and they are currently lacking. Consolidation below the Moving Average on the 4-hour chart can hardly be considered a signal indicating the beginning of a new long-term trend.
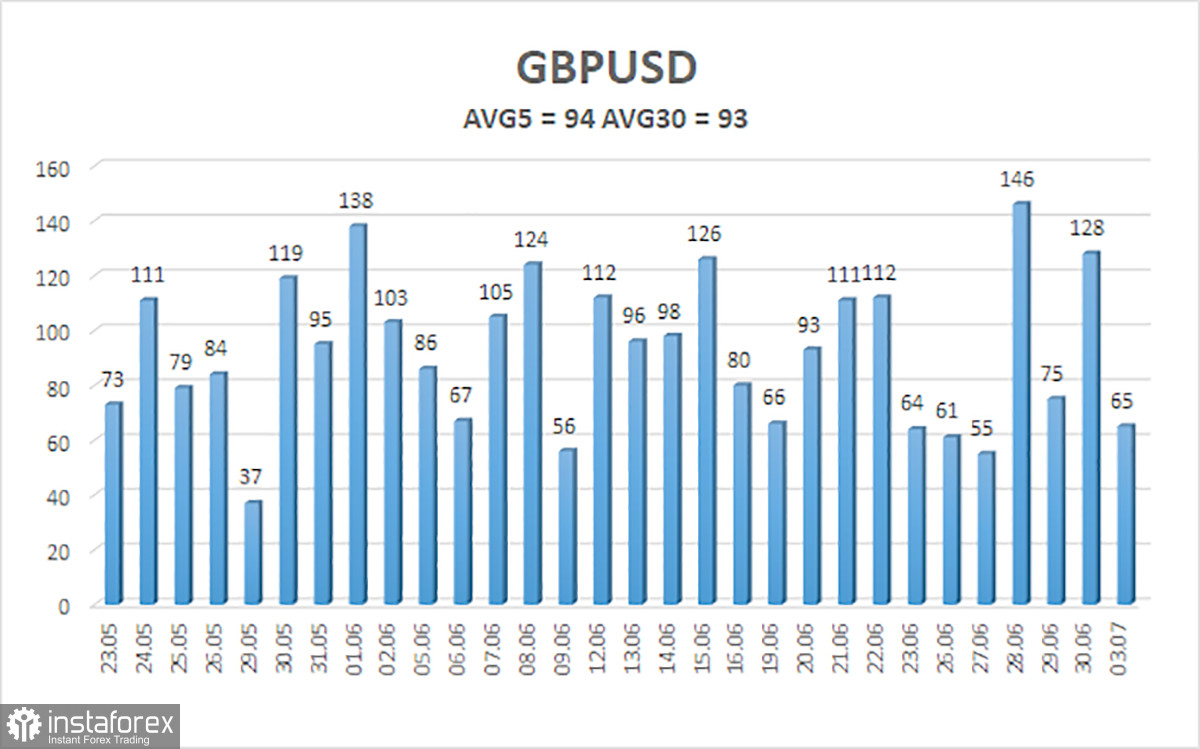
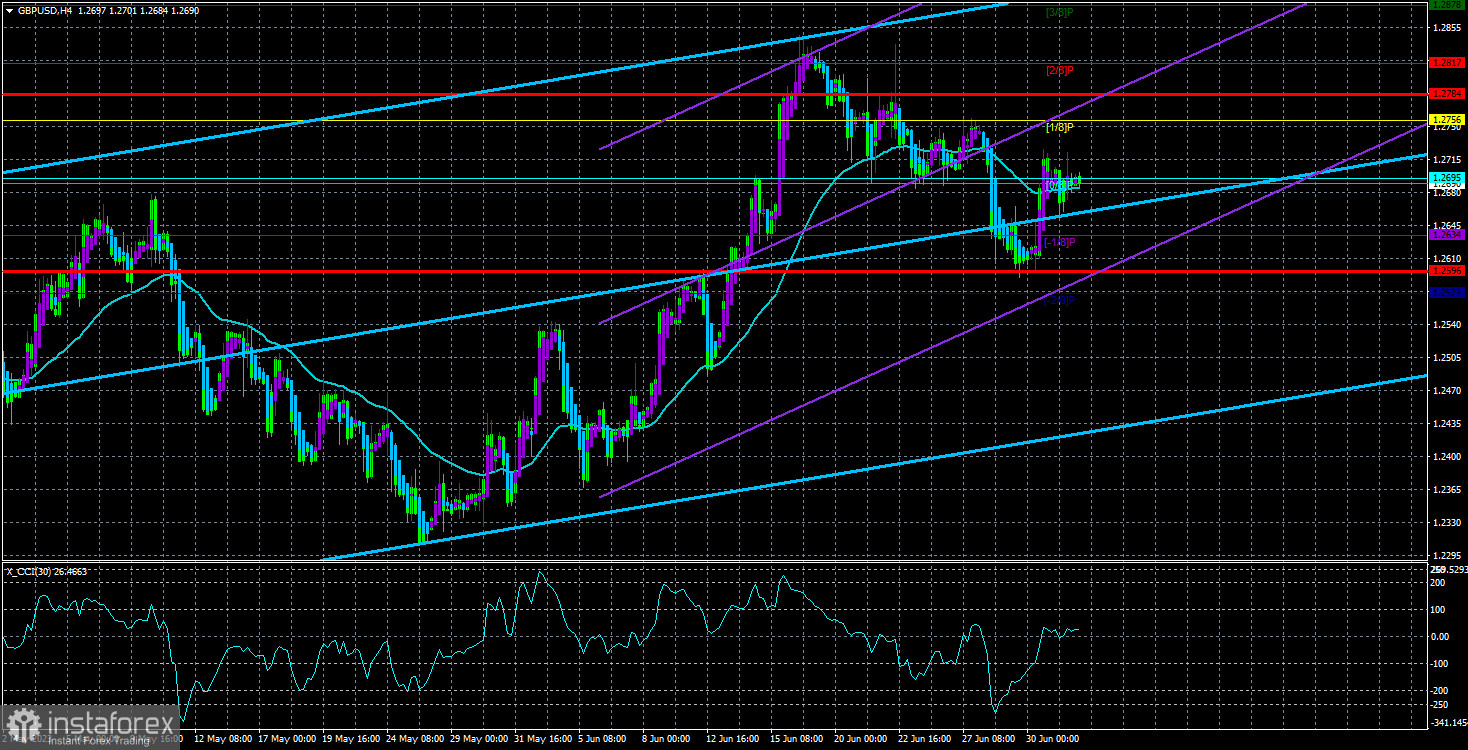
The 5-day average volatility of GBP/USD totals 94 pips on July 4 and is considered moderate. We anticipate the price to be in the range between 1.2596 and 1.2784 on Tuesday. The Heiken Ashi's reversal to the downside will indicate a resumption of the downtrend.
Support:
S1 – 1.2634
S2 – 1.2573
Resistance:
R1 – 1.2695
R2 – 1.2756
R3 – 1.2817
Outlook:
A bearish correction of GBP/USD is still ongoing on the 4-hour chart. We can buy with targets at 1.2756 and 1.2784 above the Moving Average and sell after consolidation below the MA, targeting 1.2634 and 1.2596. Today, there is a high probability of a flat market.
Indicators on charts:
Linear Regression Channels help identify the current trend. If both channels move in the same direction, a trend is strong.
Moving Average (20-day, smoothed) defines the short-term and current trends.
Murray levels are target levels for trends and corrections.
Volatility levels (red lines) reflect a possible price channel the pair is likely to trade in within the day based on the current volatility indicators.
CCI indicator. When the indicator is in the oversold zone (below 250) or in the overbought area (above 250), it means that a trend reversal is likely to occur soon.