Details of the economic calendar on June 29
U.S. jobless claims unexpectedly decreased last week, as per data published Thursday. The number of continuing claims for benefits fell by 19,000, while the number of initial claims declined by 26,000.
This divergence from expectations caused the value of the U.S. dollar to rise.
Analysis of trading charts from June 29
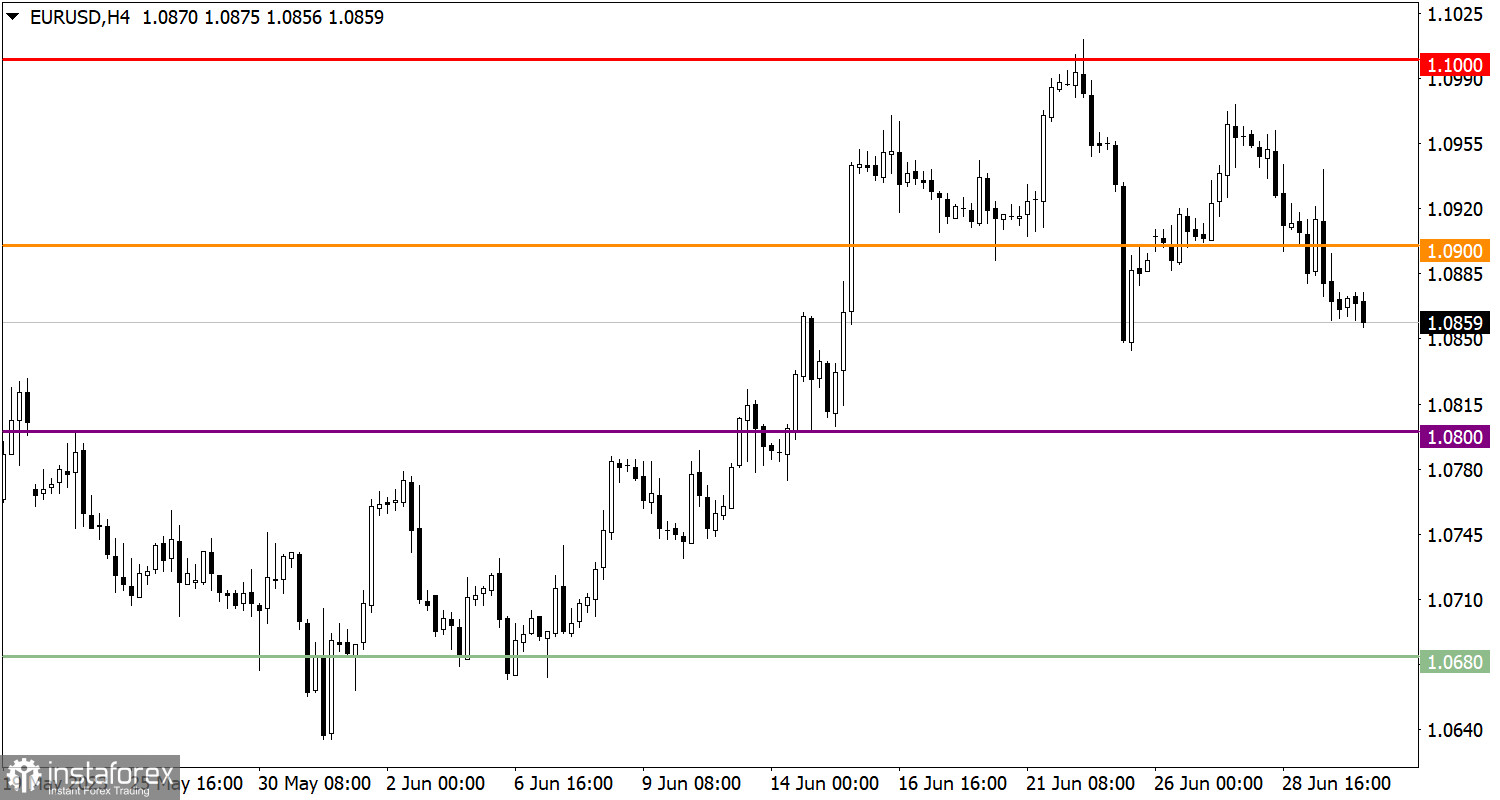
The EUR/USD currency pair returned to the base level of the correction cycle during a downward movement. This price movement indicates a prevailing downward interest among market participants.
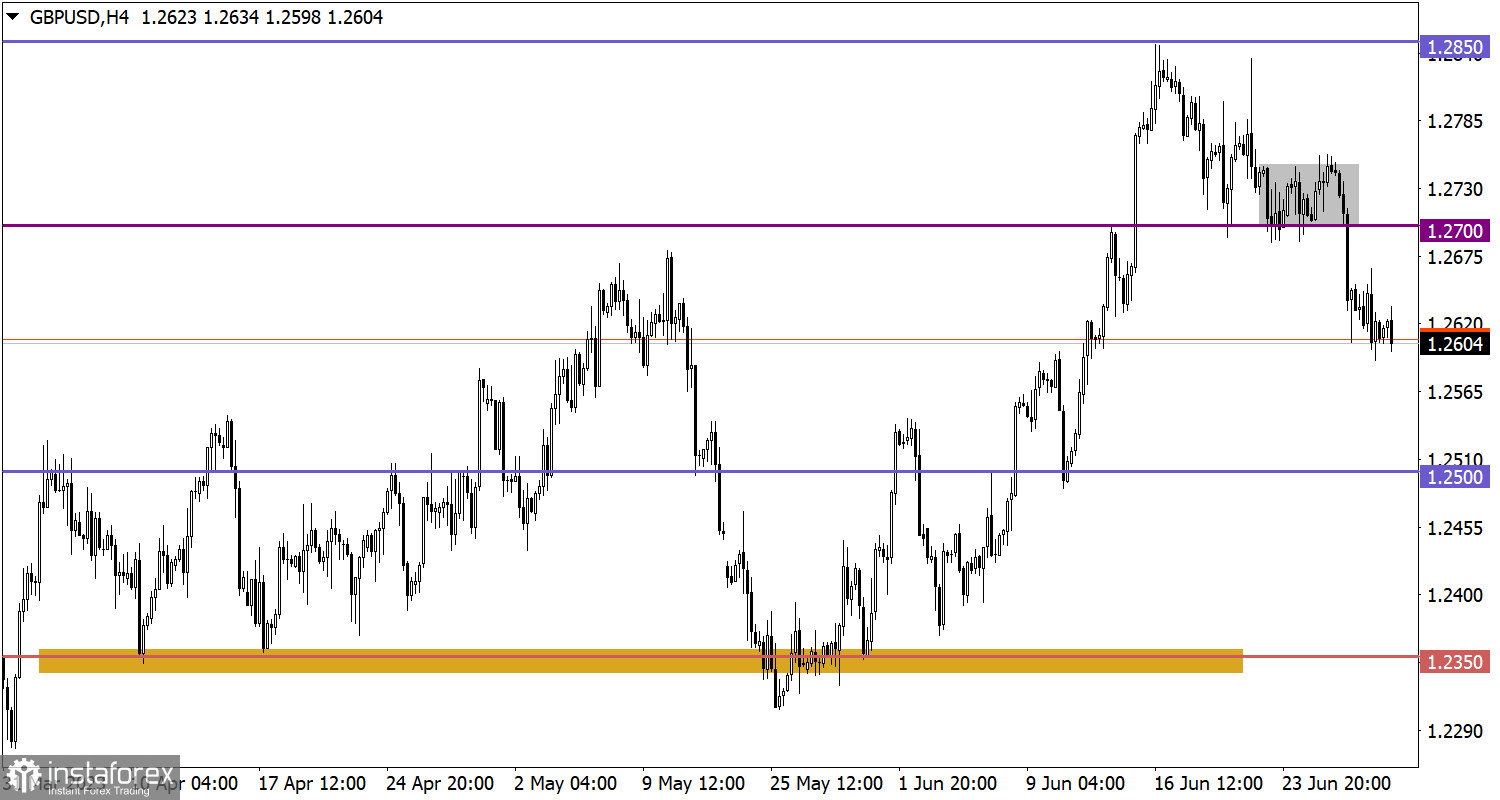
The GBP/USD pair is in the process of correction from the resistance level of 1.2850. As a result of this movement, the exchange rate of the British pound decreased by approximately 2%. It is important to note that despite significant price changes, the medium-term trend is still upward.

Economic calendar for June 30
Today, the publication of the preliminary inflation estimate in the European Union is expected, with a forecasted decrease from 6.1% to 5.6%. This is positive data; however, if the actual inflation figures turn out to be lower than expected, for example, if the decline is insignificant, it may trigger a reverse reaction in the market.
Time targeting:
EU Inflation – 09:00 UTC
EUR/USD trading plan for June 30
In this context, if the euro exchange rate against the US dollar remains below the level of 1.0845, it may lead to the continuation of the current corrective movement. In that case, further decline to the level of 1.0800 are possible. It is important to note that a strong news background can provoke speculative market movements.

GBP/USD trading plan for June 30
In the case of the continuation of the current corrective movement in the market, a decrease in the exchange rate to the level of 1.2500 is possible. Note that such a decline will not disrupt the overall upward trend, and sellers will not be able to significantly disrupt its course. In the near future, traders will actively seek possible support levels, around which a sequential process of restoring long positions on the British pound may occur.

What's on the charts
The candlestick chart type is white and black graphic rectangles with lines above and below. With a detailed analysis of each individual candle, you can see its characteristics relative to a particular time frame: opening price, closing price, intraday high and low.
Horizontal levels are price coordinates, relative to which a price may stop or reverse its trajectory. In the market, these levels are called support and resistance.
Circles and rectangles are highlighted examples where the price reversed in history. This color highlighting indicates horizontal lines that may put pressure on the asset's price in the future.
The up/down arrows are landmarks of the possible price direction in the future.
 English
 Русский
 Bahasa Indonesia
 Bahasa Malay
 ไทย
ไทย Español
 Deutsch
 Български
 Français
 Tiếng Việt
 中文
中文 বাংলা
বাংলা हिन्दी
 Čeština
 Українська
 Română

