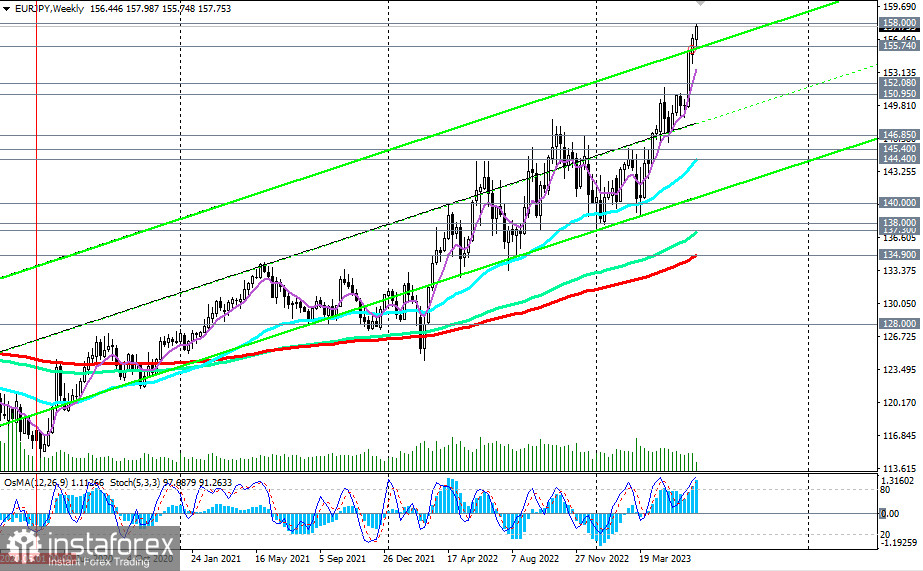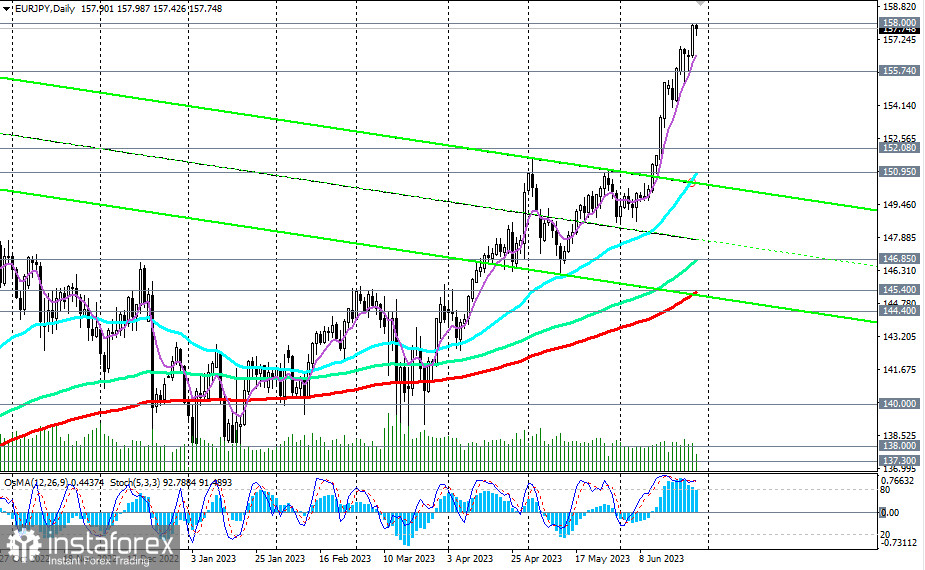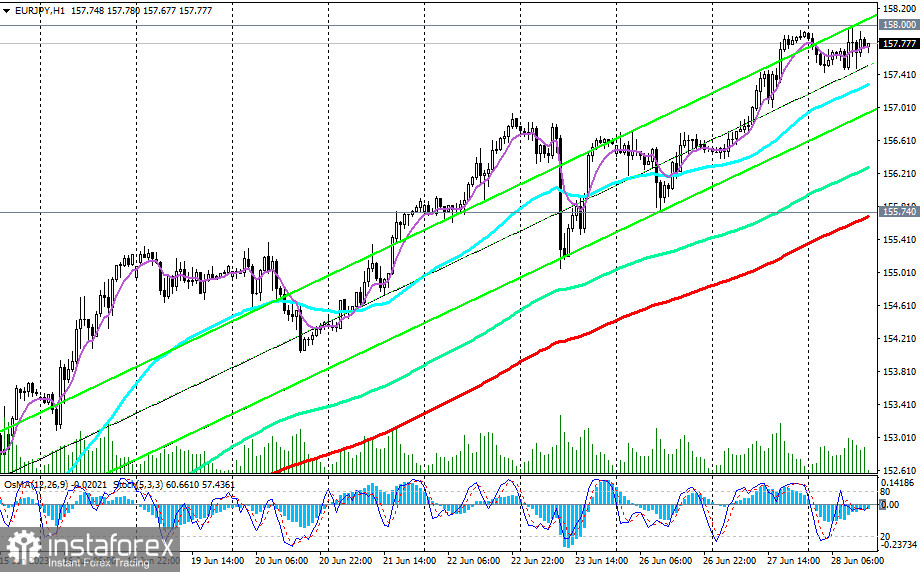
As of writing, EUR/JPY is trading within a long-term bullish trend.
In June alone, EUR/JPY has gained over 6% in price, approaching the 158.00 level. The current situation and the strengthening of the euro provide a basis for expecting further growth in EUR/JPY towards the multi-year high at 170.00.
Today, ECB President Christine Lagarde may give EUR/JPY the necessary additional impetus if she delivers hawkish comments on the prospects of the European Central Bank's monetary policy during her speech at the ECB Forum in Sintra, Portugal.

Supporting the buyers in yen trading and the EUR/JPY pair is also the so-called carry trade, where a more expensive currency is purchased at the expense of a cheaper one.
A break above the 158.00 level would serve as a signal to open new long positions on EUR/JPY.
In an alternative scenario, a signal to open short positions could be a break below the short-term support level of 157.30 (200 EMA on the 15-minute chart) and the important short-term support level of 155.74 (200 EMA on the 1-hour chart).

In the event of the development of this scenario, the targets for the downward correction could be the support levels at 152.10 (200 EMA on the 4-hour chart), 152.00, 151.10, 150.95 (50 EMA on the daily chart).
It is not advisable to expect a decline below the 151.00 level for now. Overall, a strong bullish trend and a strong upward impulse prevails.
Although theoretically, a break below the 151.00 support level could trigger further decline towards the key support levels at 146.85 (144 EMA on the daily chart), 145.40 (200 EMA on the daily chart), breaking which would disrupt the medium-term bullish trend of the pair while still remaining within the framework of the long-term bullish trend (above the support levels of 135.00, 134.90 (200 EMA on the weekly chart).
Support levels: 157.30, 155.75, 152.10, 151.00, 146.85, 145.40, 144.40, 140.00, 138.00, 137.30
Resistance levels: 158.00, 170.00
 English
 Русский
 Bahasa Indonesia
 Bahasa Malay
 ไทย
ไทย Español
 Deutsch
 Български
 Français
 Tiếng Việt
 中文
中文 বাংলা
বাংলা हिन्दी
 Čeština
 Українська
 Română

