Technical Market Outlook:
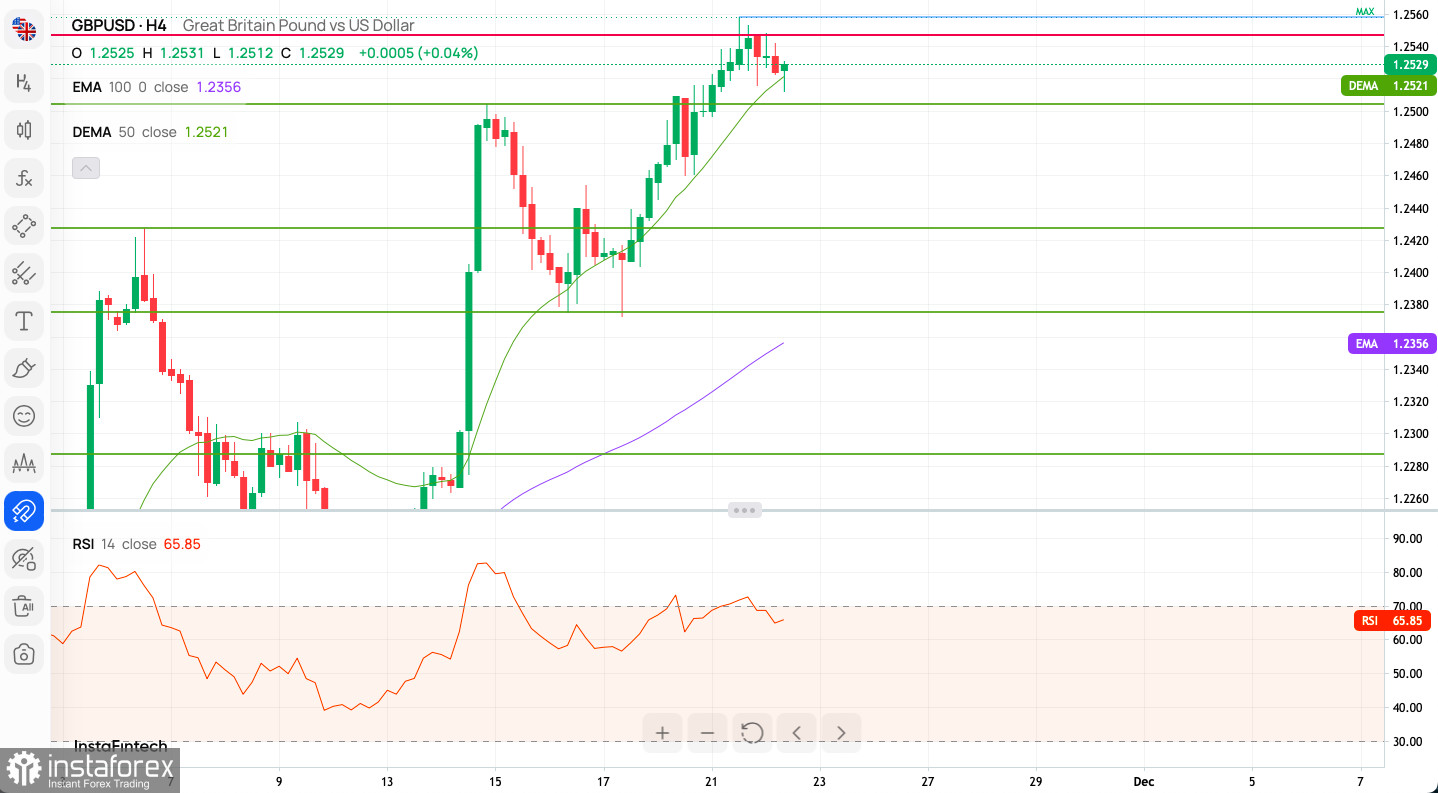
The GBP/USD pair has surpassed last week's high at 1.2504, establishing a new swing high at 1.2558. Intraday technical support is identified at 1.2504 and 1.2521, while bullish momentum target is set at 1.2590. It's important to note that the mid-term perspective remains bearish, primarily due to the Bearish Cross observed between the 50 and 100 DMA on the daily chart. Unless the long-term technical resistance level of 1.2550 is decisively breached, there is a likelihood of a resumption of the downtrend. Additionally, a conspicuous Bearish Divergence is evident between the price and momentum oscillator on the H4 timeframe, suggesting the potential for a pullback reaching the level of 1.2373 (technical support).

Weekly Pivot Points:
WR3 - 1.2868
WR2 - 1.2687
WR1 - 1.2575
Weekly Pivot - 1.2394
WS1 - 1.2282
WS2 - 1.2101
WS3 - 1.1989
Trading Outlook:
The weekly time frame chart reveals a decisive Bullish Engulfing candlestick pattern materializing amid the breakout beyond the 1.2340 level, signaling the dominance of bullish sentiment as prices continue to climb. Currently, the market is trading above the 50-week moving average (WMA) and is on course towards the 100 WMA positioned at 1.2504. Conversely, a sustained breakout below the critical long-term technical support at 1.1802 significantly heightens the probability of a substantial downward movement, potentially targeting the level of 1.1494.
 English
 Русский
 Bahasa Indonesia
 Bahasa Malay
 ไทย
ไทย Español
 Deutsch
 Български
 Français
 Tiếng Việt
 中文
中文 বাংলা
বাংলা हिन्दी
 Čeština
 Українська
 Română

