EUR/USD

Higher timeframes
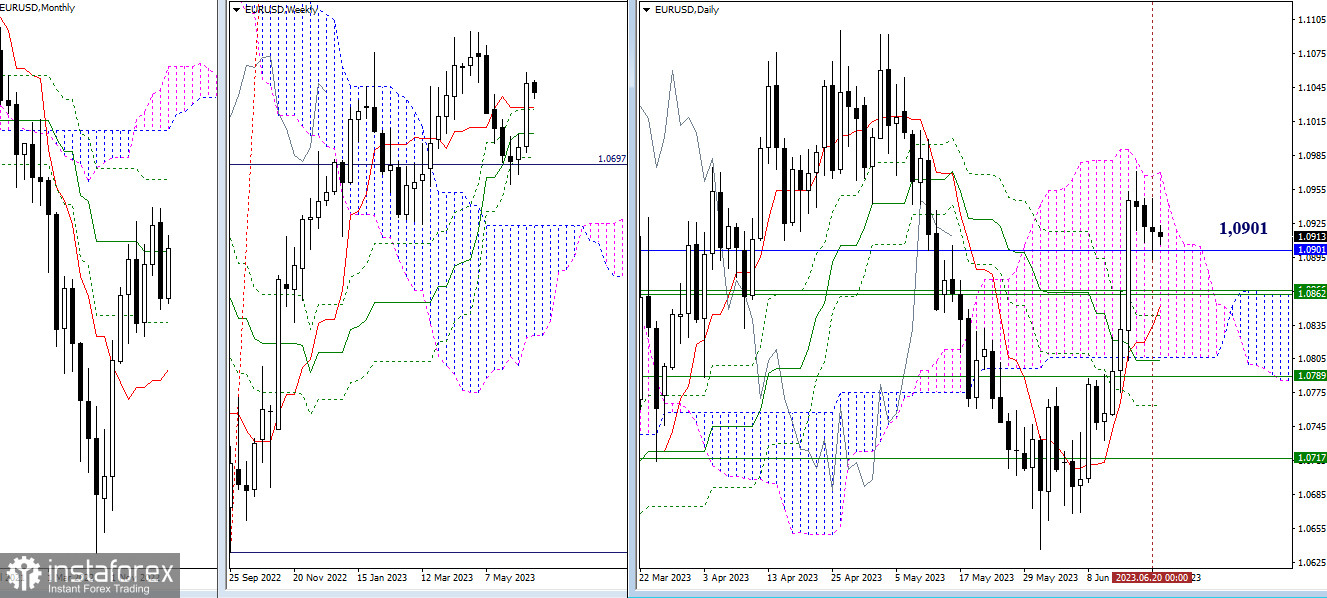
The pause allowed by the bulls is maintained. At the same time, the pair is testing the support of the monthly medium-term trend (1.0901). A breakout of this level will shift attention to the next support area of 1.0866 - 1.0843, which combines daily and weekly levels. The bulls' target within the day is to break through the daily Ichimoku cloud (1.0970) into the bullish zone, followed by updating the all-time high of the last months (1.1096), which will allow considering the recovery of the upward trend on the weekly chart.

H4 - H1
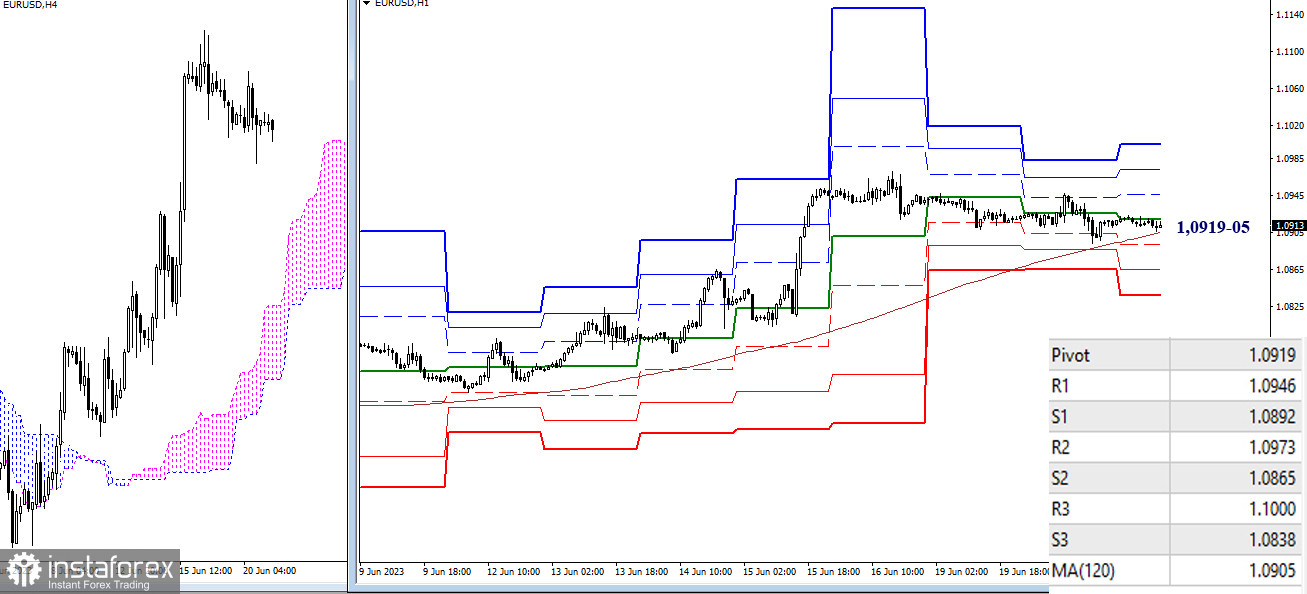
The pair continues to trade in the correction zone on the lower timeframes. The current corrective decline is insignificant, forming a sideways movement. Today, key levels have joined forces in a relatively narrow range of 1.0919-05 (central pivot point + weekly long-term trend). Trading above the key levels will have bulls maintain the main advantage, with intraday targets at 1.0946 - 1.0973 - 1.1000 (resistances of classic pivot points), while trading below will strengthen bearish sentiments, with the aim of breaking through the supports of classic pivot points (1.0892 - 1.0865 - 1.0838).
***
GBP/USD

Higher timeframes
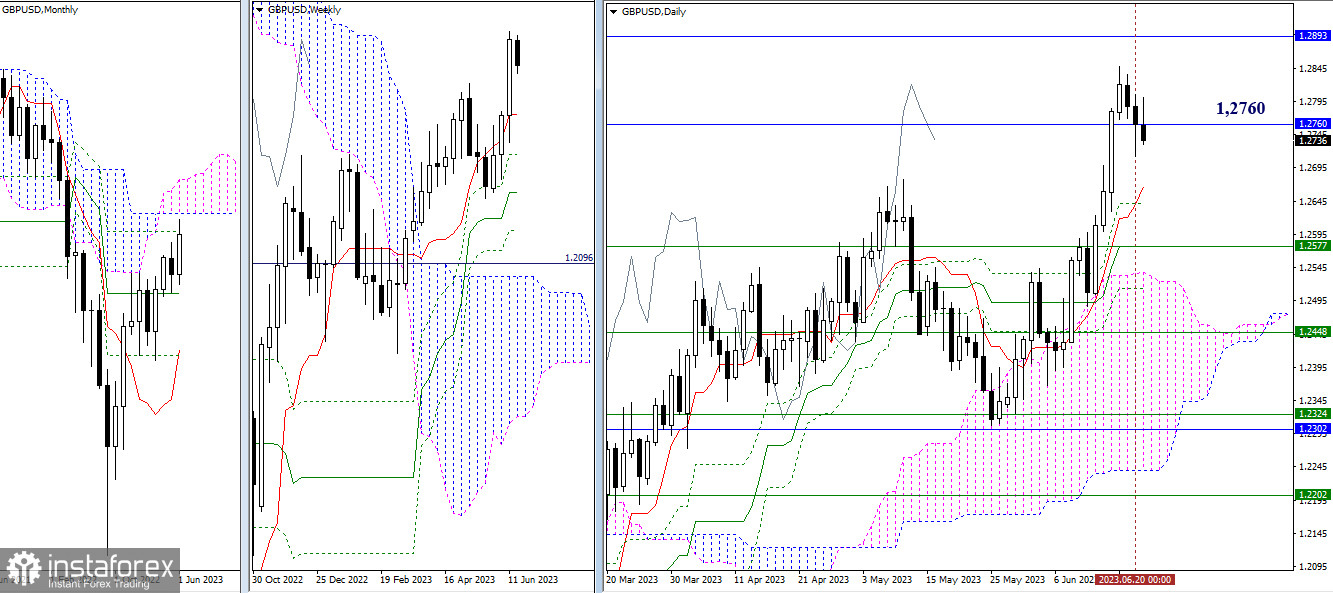
Bearish players are trying to recover their positions and capture the monthly level of 1.2760. Their next targets in the current situation are the daily levels (1.2666 - 1.2641) and the weekly short-term trend (1.2577). If bulls can now hold the monthly level of 1.2760, they will face testing of the monthly Ichimoku cloud (1.2893 - 1.3141).

H4 - H1
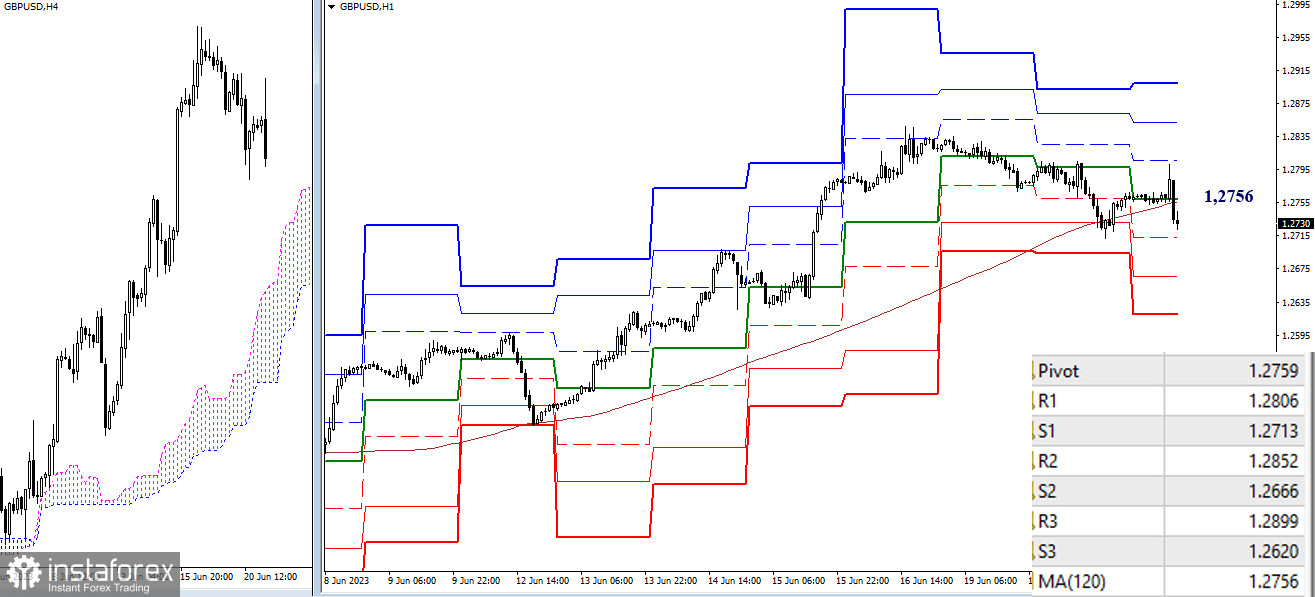
On the lower timeframes, there is currently a struggle for control of the key levels. Today, they have converged at the level of 1.2756-59 (central pivot point of the day + weekly long-term trend). In the event of a further decline, bears within the day will rely on the supports of classic pivot points (1.2713 - 1.2666 - 1.2620), while in the case of bullish activity, bulls will be interested in the resistances of classic pivot points (1.2806 - 1.2852 - 1.2899).
***
The technical analysis of the situation uses:
Higher timeframes - Ichimoku Kinko Hyo (9.26.52) + Fibo Kijun levels
Lower timeframes - H1 - Pivot Points (classic) + Moving Average 120 (weekly long-term trend)
 English
 Русский
 Bahasa Indonesia
 Bahasa Malay
 ไทย
ไทย Español
 Deutsch
 Български
 Français
 Tiếng Việt
 中文
中文 বাংলা
বাংলা हिन्दी
 Čeština
 Українська
 Română

