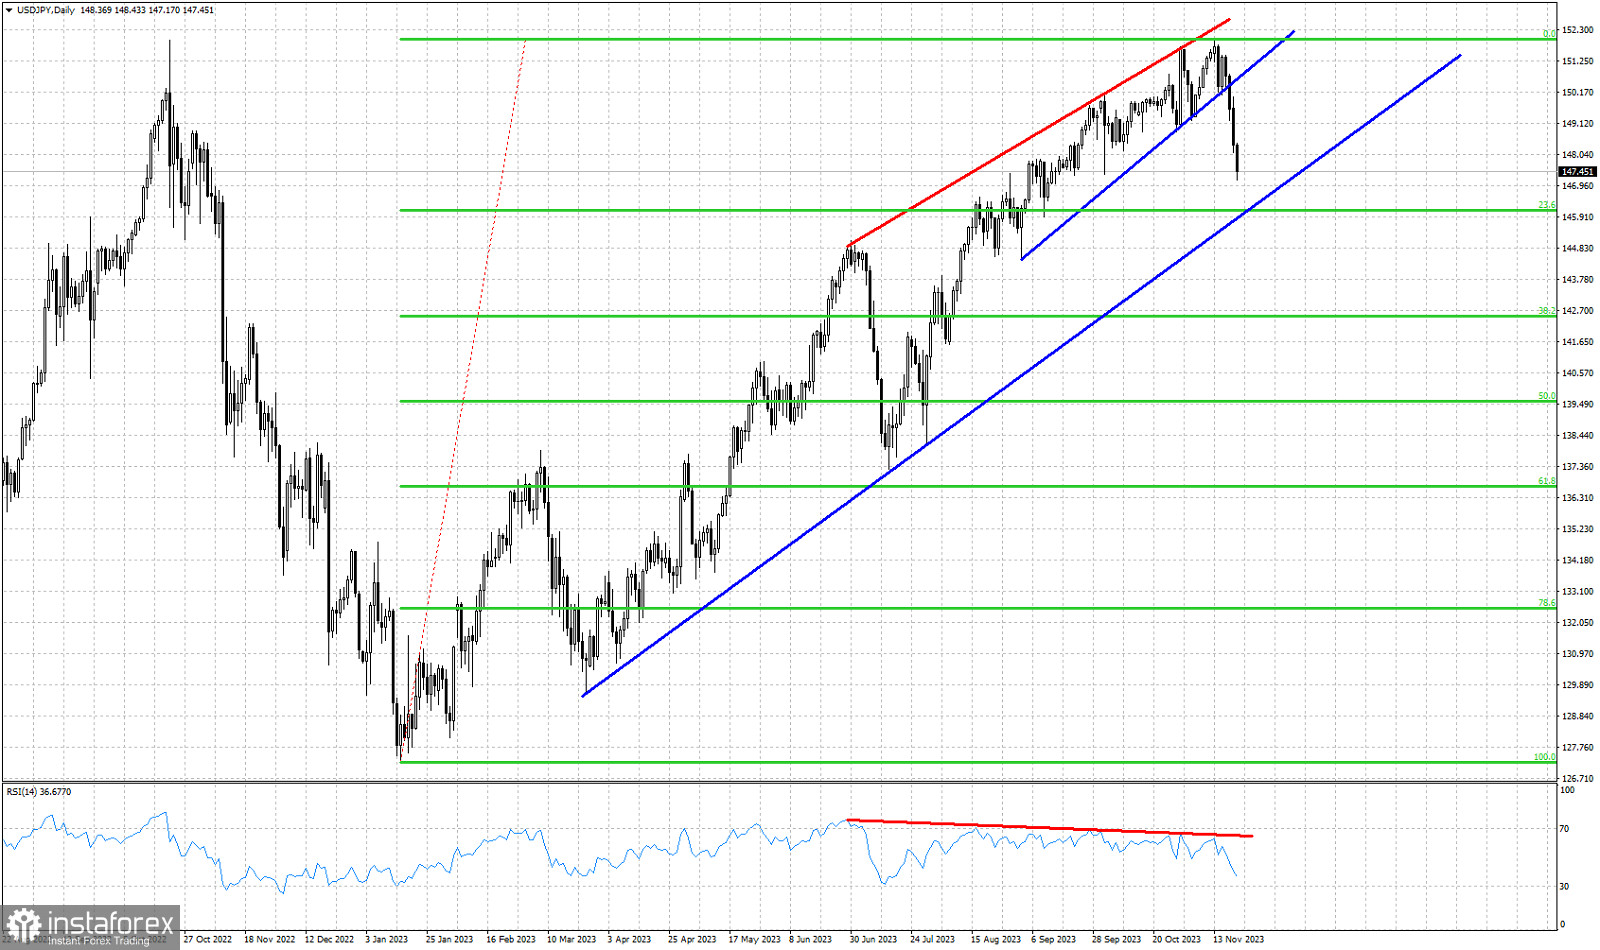
Red lines- bearish RSI divergence
Blue lines- support trend lines
Green lines- Fibonacci retracement levels
USDJPY is trading around 147.63. Today price is making lower lows. Short-term trend is bearish. Price has broken the first blue support trend line. The warning sign was given by the bearish RSI divergence and we noted this last week. The break below 150.20-150 confirmed the short-term reversal signal. Next downside target is the 23.6% Fibonacci retracement of the entire upward move from 127.24 and the second blue upward sloping support trend line around 146.10. The RSI has still not reached oversold levels and that is why we expect USDJPY to continue lower over the coming two weeks. We might see a bounce for one or two trading sessions, but overall we expect USDJPY to see lower levels.
 English
 Русский
 Bahasa Indonesia
 Bahasa Malay
 ไทย
ไทย Español
 Deutsch
 Български
 Français
 Tiếng Việt
 中文
中文 বাংলা
বাংলা हिन्दी
 Čeština
 Українська
 Română

