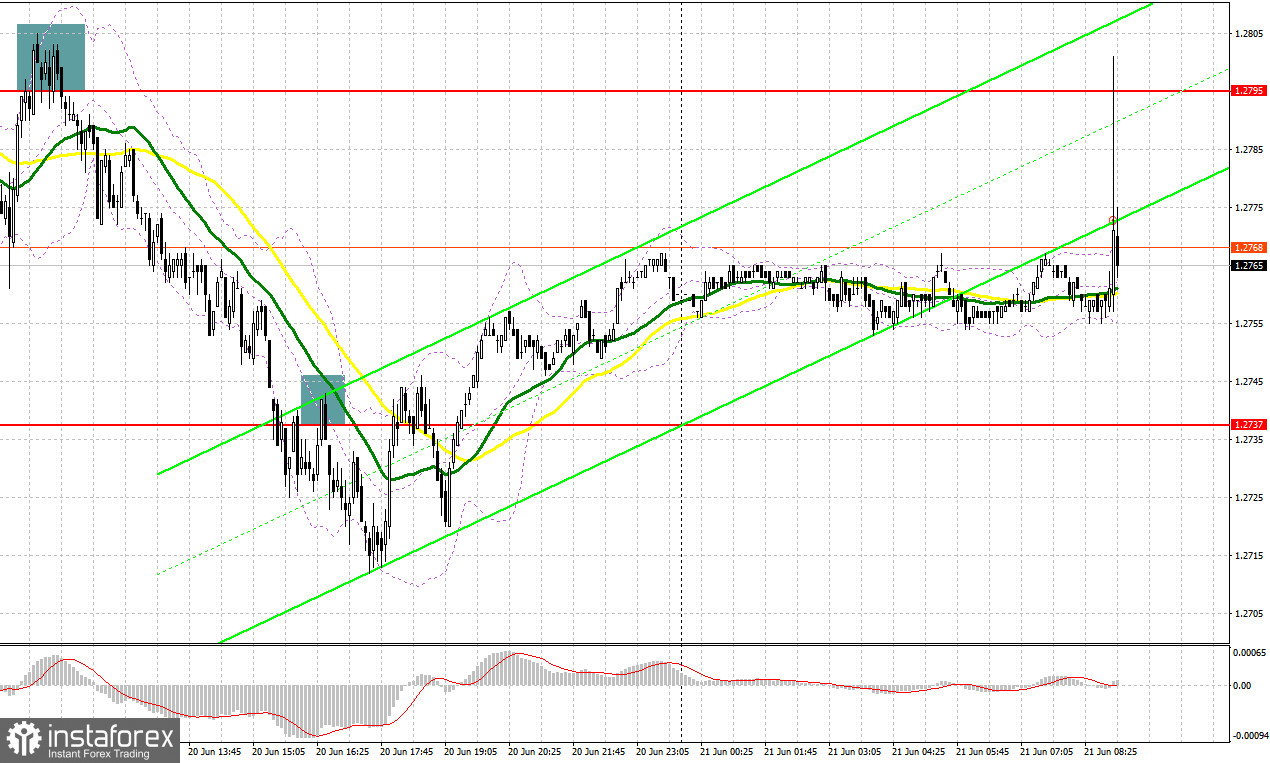
Yesterday, several excellent market entry signals were formed. Let's take a look at the 5-minute chart and analyze what happened. In my morning forecast, I highlighted the level of 1.2801 and recommended making trading decisions with this level in mind. The rise and formation of a false breakout at this level created a sell signal for the pound, leading to a decline of over 40 pips. The breakthrough and subsequent retest of 1.2737 in the second half of the day provided another sell signal, leading to a further downward movement of 25 pips.

When to open long positions on GBP/USD:
The release of UK inflation data sent GBP upwards at the beginning of the European session today. The pound sterling then encountered resistance around 1.2795. Further growth of the pound sterling alongside inflation is possible, but the upside potential of GBP will be limited by tomorrow's Bank of England meeting. Although the regulator will continue to raise interest rates, it is difficult to speculate on the future monetary policy at this point.
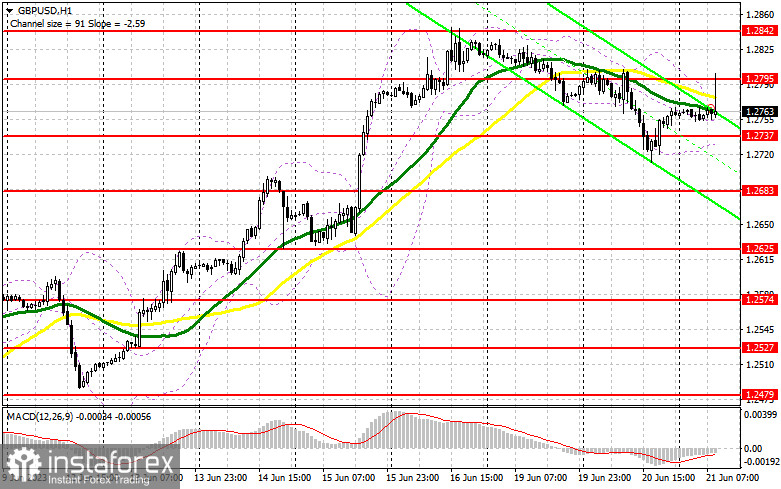
For this reason, I will act if there is a correction around the new support level of 1.2737, formed after yesterday's session. A false breakout of this level will serve as an entry point for long positions, continuing the trend. The target for the pair's recovery in this case will be the resistance at 1.2795. Bulls need to hold on to this level urgently, so a breakout and consolidation above this range will provide an additional buy signal with a surge towards a new monthly high at 1.2842, further strengthening the uptrend. The most distant target will be the area around 1.2876, where I will take profits. If the pair declines towards 1.2737 amid the absence of buyer activity, pressure on the pound will increase significantly, indicating possible technical changes in the balance of power among market participants. In such a case, only the defense of the next area at 1.2683, as well as a false breakout there, will create a sell signal. I plan to buy GBP/USD only on a rebound from 1.2625, aiming for a 30-35 pip intraday correction, but it is unlikely to reach that level before then.
When to open short positions on GBP/USD:
The bears have achieved a significant correction, and much will now depend on the decision of the Bank of England. Today's inflation data brought demand back to the pound, and sellers have already shown themselves around 1.2795. As long as trading remains below this area, we can expect a continuation of the downward correction. Another false breakout at 1.2795 will provide a sell signal, but the drop from this level should be quite swift. If, after a slight decline in the pair, it returns to 1.2795, it is best to avoid short positions in such a bullish market.

An equally important target for the bears will be a breakthrough and an upward retest of 1.2737, which will deliver a more significant blow to the positions of bulls and renew pressure on GBP/USD. This will a sell signal with a correction to 1.2683. The most distant target remains the low at 1.2625, where I will take profits. If GBP/USD rises amid and the absence of activity at 1.2795, the downward correction will come to an end, and the bulls will continue to control the market, aiming for a new monthly high. In such a case, I will postpone selling until the pair tests the resistance at 1.2842. A false breakout there will serve as an entry point for short positions. If there is no downward movement at that point, I will open short positions on GBP/USD on a rebound from 1.2876, but only expecting an intraday correction of 30-35 pips.
Commitment of Traders (COT) report:
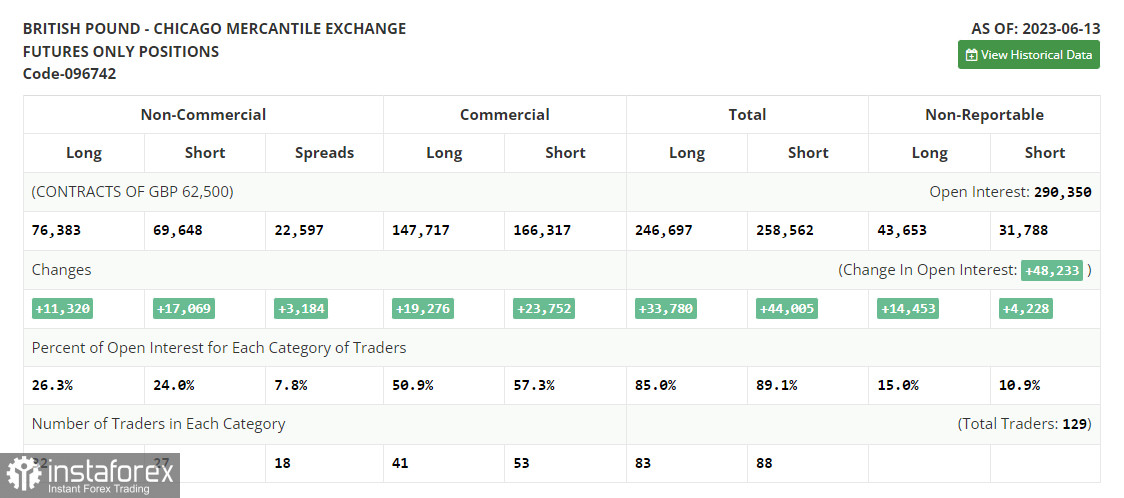
The Commitment of Traders (COT) report for June 13 showed that both long and short positions increased sharply. The pound sterling has risen significantly recently, attracting the attention of bears. However, the aggressive policy of the Bank of England and the latest inflation data in the UK are bringing new bulls into the market, who are expecting further interest rate hikes. The fact that the Federal Reserve has paused its tightening cycle while the Bank of England has no plans to do so makes GBP quite attractive. The latest COT report states that short non-commercial positions increased by 17,069 to 69,648, while long non-commercial positions jumped by 11,320 to 76,383. The non-commercial net position decreased to 6,736 from 12,454 in the previous week. The weekly price rose to 1.2605 from 1.2434.

Indicator signals:
Moving Averages
Trading is taking place around the 30-day and 50-day moving averages, indicating market uncertainty.
Note: The period and price of the moving averages considered by the author are on the hourly chart (H1) and differ from the general definition of classical daily moving averages on the daily chart (D1).
Bollinger Bands
If GBP/USD declines, the lower boundary of the indicator at 1.2735 will provide support.
Description of indicators
Moving average (moving average, determines the current trend by smoothing out volatility and noise). Period 50. It is marked yellow on the chart. Moving average (moving average, determines the current trend by smoothing out volatility and noise). Period 30. It is marked green on the chart. MACD indicator (Moving Average Convergence/Divergence - convergence/divergence of moving averages) Quick EMA period 12. Slow EMA period to 26. SMA period 9 Bollinger Bands (Bollinger Bands). Period 20 Non-commercial speculative traders, such as individual traders, hedge funds, and large institutions that use the futures market for speculative purposes and meet certain requirements. Long non-commercial positions represent the total long open position of non-commercial traders. Short non-commercial positions represent the total short open position of non-commercial traders. Total non-commercial net position is the difference between the short and long positions of non-commercial traders. English
 Русский
 Bahasa Indonesia
 Bahasa Malay
 ไทย
ไทย Español
 Deutsch
 Български
 Français
 Tiếng Việt
 中文
中文 বাংলা
বাংলা हिन्दी
 Čeština
 Українська
 Română

