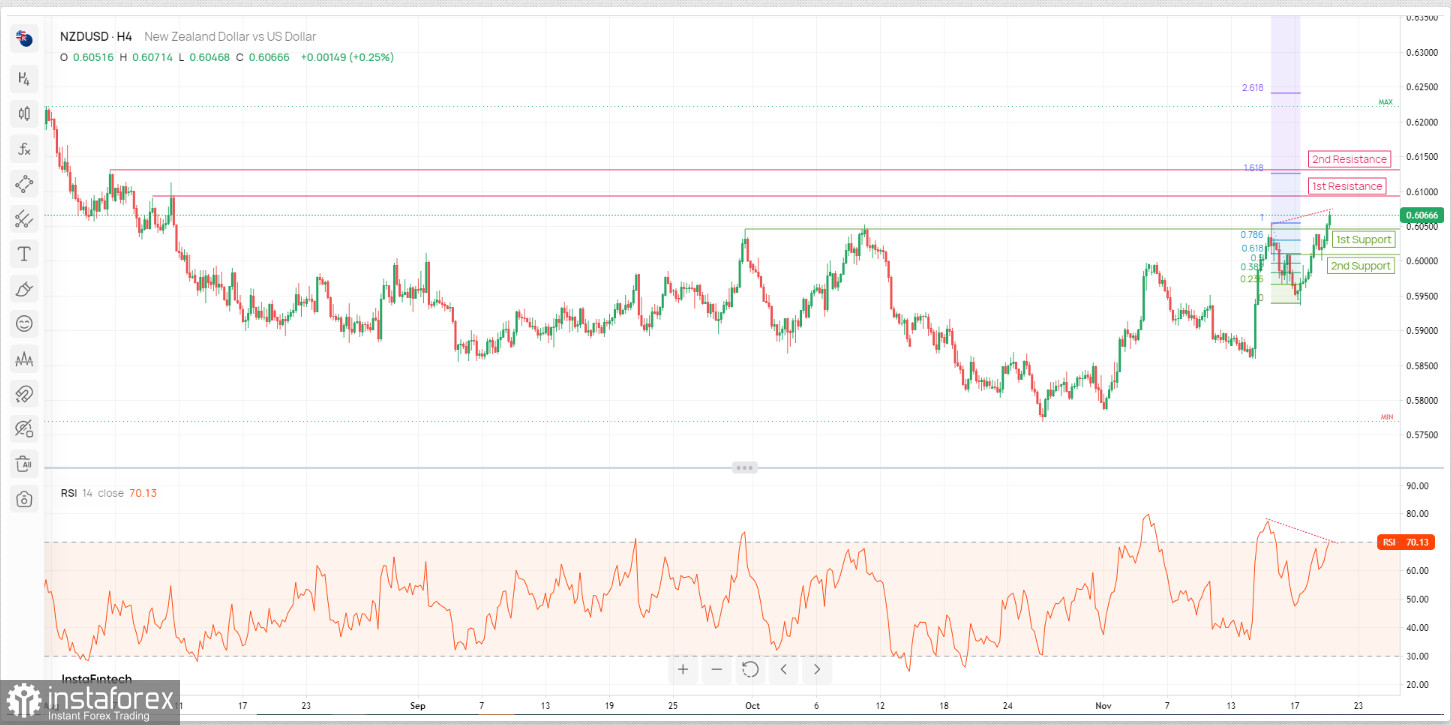
The NZD/USD chart currently exhibits a bullish momentum, potentially leading to further upward movement towards the 1st resistance. However, the RSI indicator is highlighting a bearish divergence versus the current price action, suggesting a potential reversal point in the near term.
The 1st resistance level (0.6095) is noted as a pullback resistance while the 2nd resistance level (0.6130) is also marked as a pullback resistance that aligns with the 161.80% Fibonacci extension, heightening its importance as a key resistance zone.
To the downside, the 1st support level (0.6045) is identified as a pullback support where buying interest may emerge, offering support to the currency pair. Additionally, the 2nd support (0.6010), is categorized as an overlap support, indicating a level where buyers may become more active.
In summary, NZD/USD has a bullish outlook with the potential for price to rise towards the 1st resistance. However, the RSI indicator is highlighting a bearish divergence versus the current price action, suggesting a potential reversal point in the near term.
 English
 Русский
 Bahasa Indonesia
 Bahasa Malay
 ไทย
ไทย Español
 Deutsch
 Български
 Français
 Tiếng Việt
 中文
中文 বাংলা
বাংলা हिन्दी
 Čeština
 Українська
 Română

