EUR/USD

Higher timeframes
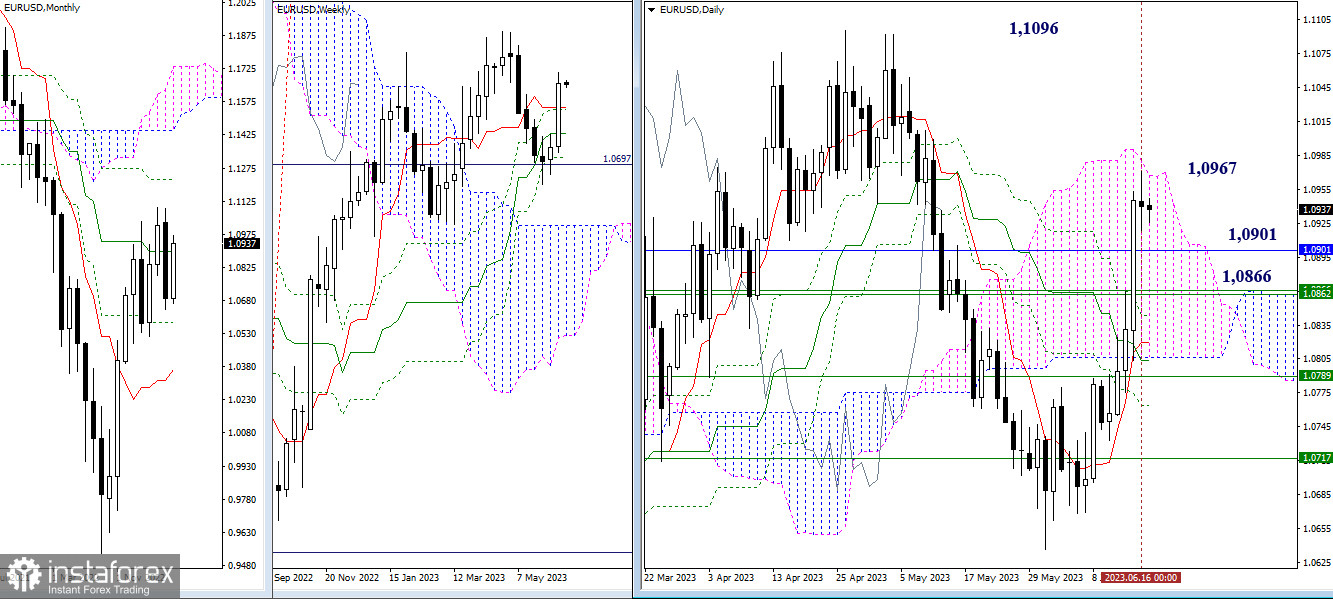
After a successful upward movement, bulls slowed down, but overall, the nature of the last weekly candle expresses bullish optimism. Among the primary tasks for bulls, it is worth noting breaking above the daily Ichimoku cloud (1.0967) into the bullish zone and updating the highest peak of recent months (1.1096) to restore the weekly upward trend. The levels passed yesterday maintain their role and significance as immediate supports today, located at 1.0901-1.0866 (monthly medium-term trend + weekly short-term trend).

H4 - H1
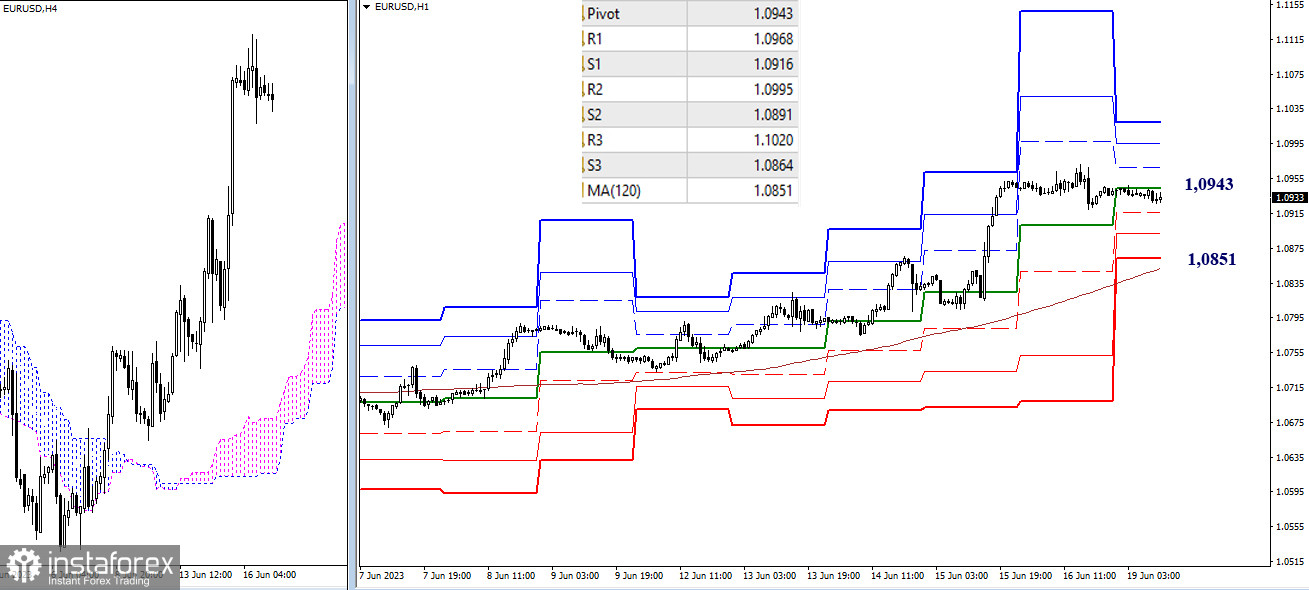
The main advantage on the lower timeframes currently belongs to the bulls. However, at the moment, the pair is in a correction zone. The attraction exerted by the central pivot point (1.0943) is restraining the development of the situation. In case of further decline, the support levels of the classic pivot points (1.0916-1.0891-1.0864) will come into play within the day, only after which the key level responsible for the current balance of power, the weekly long-term trend (1.0851), will become available to bears. If the current correction ends and the pair continues to rise, then the classic pivot points of the day (1.0968-1.0995-1.1020) will come into play.
***
GBP/USD

Higher timeframes
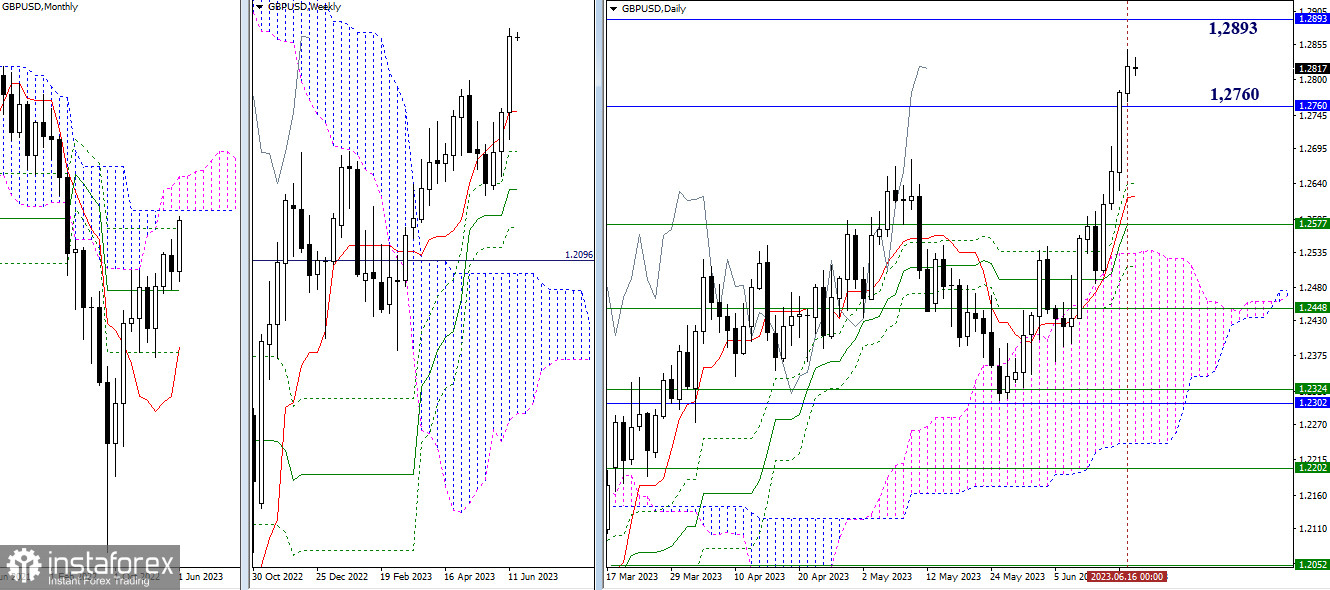
On Friday, the pair continued its upward movement and closed the previous week with bullish optimism. The nearest target for bulls in this market segment is the resistance of the monthly Ichimoku cloud (1.2893-1.3141). Breaking into the bullish zone relative to the cloud will allow considering other upward targets. The pair's retreat below the final level of the monthly Ichimoku cross (1.2760) may trigger a reversal, the end of the ascent, and the development of a new corrective wave. The next supports in this case will be the levels of the daily Ichimoku cross (1.2641-1.2620-1.2577-1.2513), reinforced by the weekly short-term trend (1.2577).

H4 - H1
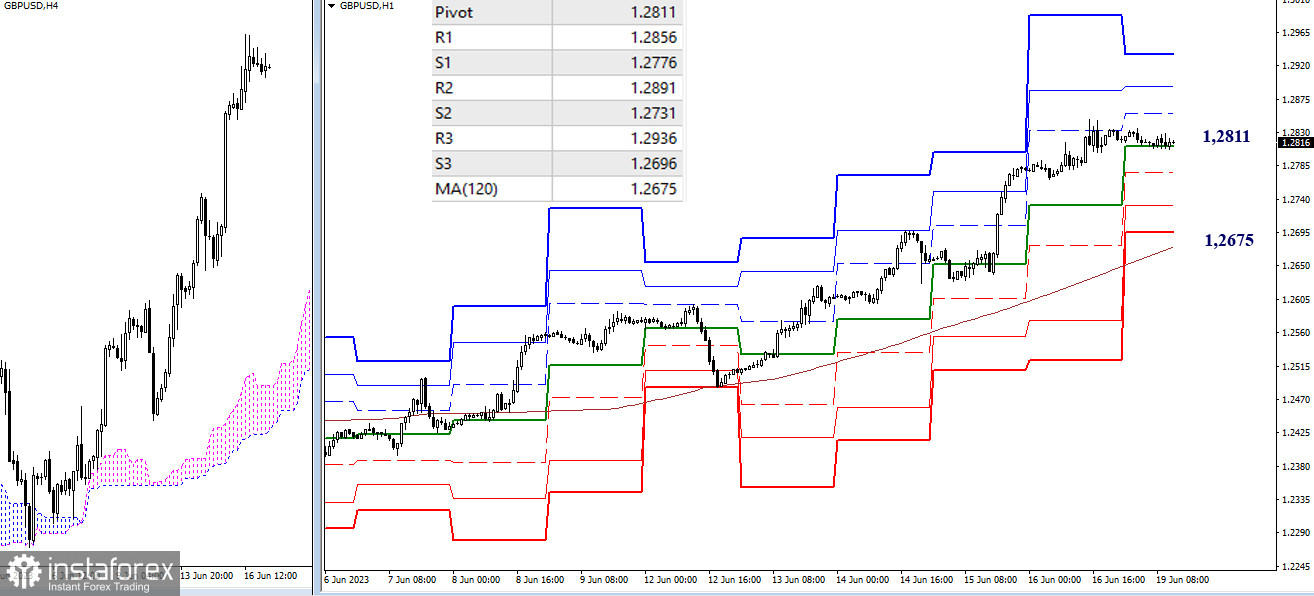
On the lower timeframes, a corrective decline is observed. The market has found support here in the form of the central pivot point of the day (1.2811). Upon the completion of the correction and the emergence of a new wave of bullish activity, testing the resistances of the classic pivot points (1.2856-1.2891-1.2936) can be expected. In case of a strengthening bearish sentiment and the development of a decline, the support of the classic pivot points (1.2776-1.2731-1.2696) will come into play. Further, the balance of power will be determined by the key level of the lower timeframes, the weekly long-term trend (1.2675).
***
The technical analysis of the situation uses:
Higher timeframes - Ichimoku Kinko Hyo (9.26.52) + Fibo Kijun levels
Lower timeframes - H1 - Pivot Points (classic) + Moving Average 120 (weekly long-term trend)
 English
 Русский
 Bahasa Indonesia
 Bahasa Malay
 ไทย
ไทย Español
 Deutsch
 Български
 Français
 Tiếng Việt
 中文
中文 বাংলা
বাংলা हिन्दी
 Čeština
 Українська
 Română

