Overview of trading on Friday
30M chart of EUR/USD

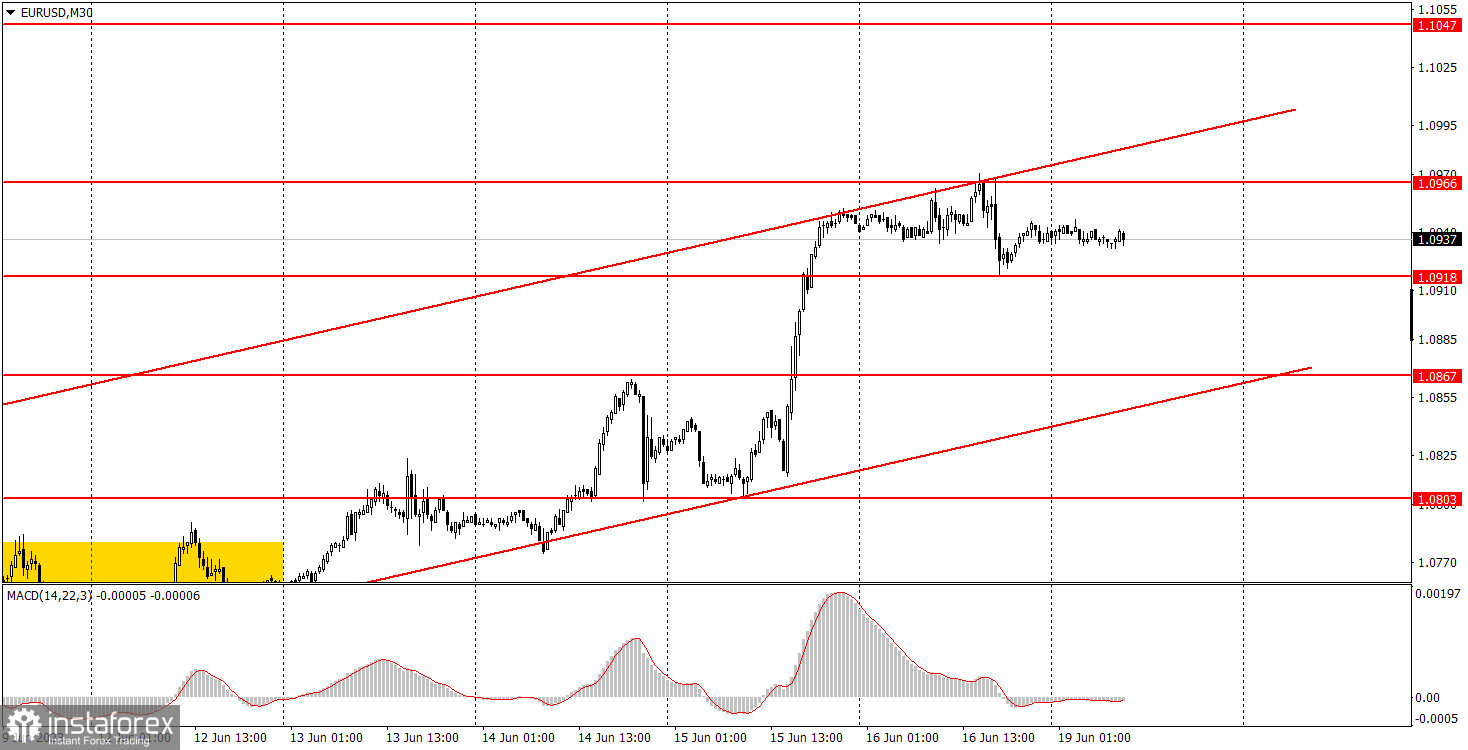
EUR/USD was locked in a flat market on Friday. The chart above displays exactly the range-bound market. The currency pair was trading between the levels of 1.0918 and 1.0966 for the while day, showing a volatility of about 50 points. Obviously, with such an economic calendar, it was quite difficult to shape a clear-cut market sentiment and trade EUR/USD. However, over the past weeks, the instrument has formed an ascending channel (which is also visible in the picture). So, for the time being, we are dealing with a clear uptrend. Despite the fact that the growth of the European currency also raises some questions, you should not count on a downtrend until the prices settles below this channel. In the medium term, we still expect the euro to weaken, but precise technical signals are needed to start working out such a movement.
On Friday, the European Union published a second estimate of the CPI for May. The data aroused a muted response from the market. The report worthy of note in the US was a consumer sentiment index by the University of Michigan, which led to a slight strengthening of the dollar.
5M chart of EUR/USD

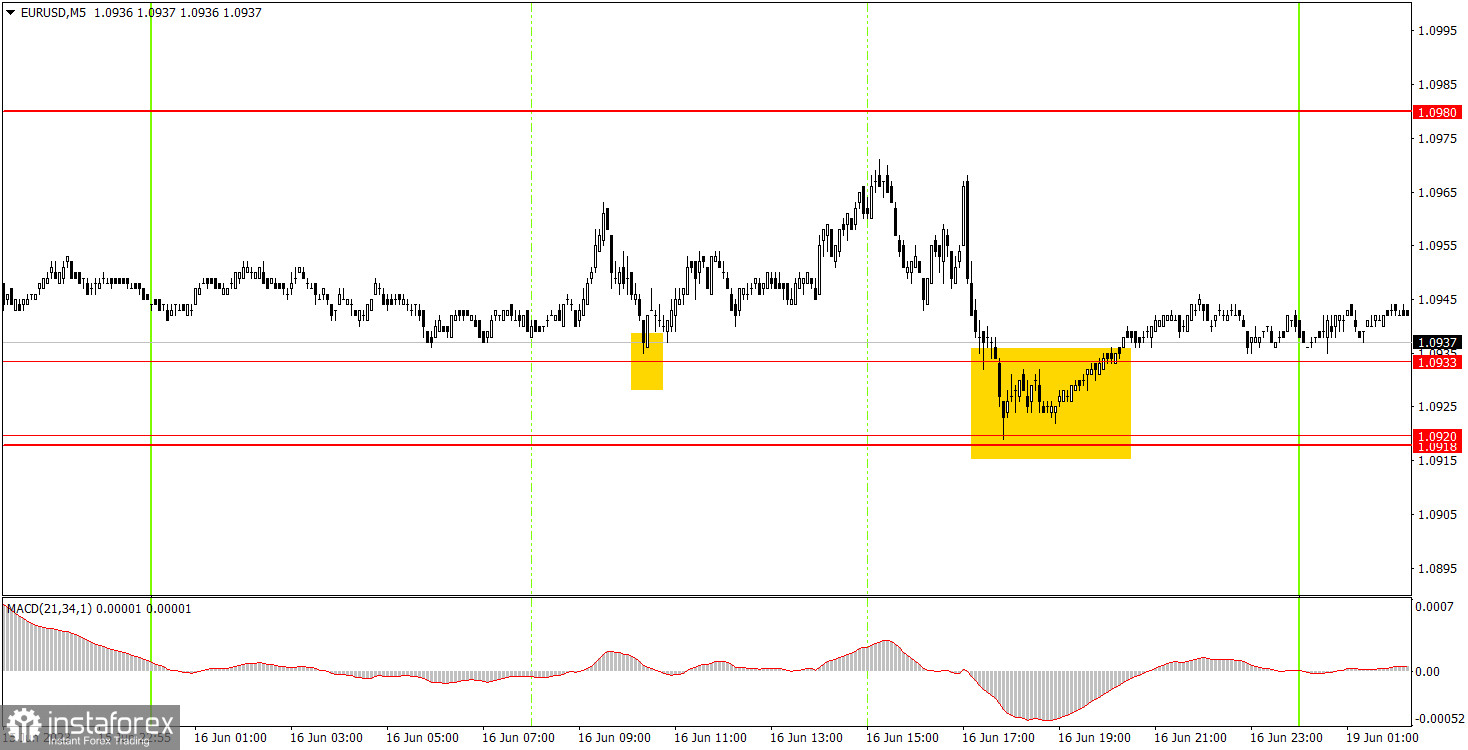
In the 5-minute timeframe, you can also clearly see that EUR/USD has been moving mostly sideways all day long. Only two trading signals were formed that novice traders could try to work out. During the European trading session, the pair rebounded from the level of 1.0933, after which it went up 25 points, but failed to reach the nearest target level. Therefore, long positions were closed by a stop loss at breakeven. The second signal to buy was formed during the New York trade, but it should not have been worked out on Friday evening. Given the nature of the price movement, EUR/USD promises a market buzz today and nice trading opportunities.
How to trade EUR/USD on Monday
In the 30-minute timeframe, the pair continues to follow an uptrend. In the medium term, we expect the euro to fall again, but it may take quite a long time before the downtrend returns to the market. The ascending channel now determines the trend and could signal its possible break. On the 5-minute timeframe tomorrow, traders should turn attention to the following levels: 1.0607-1.0613, 1.0673, 1.0733, 1.0761, 1.0803, 1.0857-1.0867, 1.0918-1.0933, 1.0980, and 1.1038. When passing 15 points in the right direction, you can set a stop loss to breakeven. On Monday, several speeches by ECB policymakers will take place in the European Union, but Christine Lagarde will not be among them. It is rather difficult to count on fundamentally new information immediately after the ECB meeting and Lagarde's speech. Nevertheless, Luis de Guindos, Philip Lane, and Isabel Schnabel can reinforce the bullish market sentiment with their comments.
Main rules of the trading system:
The strength of the signal is calculated by the time it took to form the signal (bounce/drop or overcoming the level). The less time it took, the stronger the signal.
If two or more trades were opened near a certain level due to false signals, all subsequent signals from this level should be ignored.
In a flat market, any currency pair can generate a lot of false signals or not generate them at all. But in any case, as soon as the first signs of a flat market are detected, it is better to stop trading.
Trades are opened in the time interval between the beginning of the European session and the middle of the American one when all trades must be closed manually.
On the 30-minute timeframe, you can trade based on MACD signals only on the condition of good volatility and provided that a trend is confirmed by the trend line or a trend channel.
If two levels are located too close to each other (from 5 to 15 points), they should be considered as an area of support or resistance.
Comments on charts
Support and resistance levels are levels that serve as targets when opening long or short positions. Take Profit orders can be placed around them.
Red lines are channels or trend lines that display the current trend and show which direction is preferable for trading now.
The MACD (14,22,3) indicator, both histogram and signal line, is an auxiliary indicator that can also be used as a source of signals.
Important speeches and reports (always found in the news calendar) can significantly influence the movement of a currency pair. Therefore, during their release, it is recommended to trade with utmost caution or to exit the market to avoid a sharp price reversal against the previous movement.
Beginners trading in the forex market should remember that not every trade can be profitable. Developing a clear strategy and money management is the key to success in trading over a long period of time.
 English
 Русский
 Bahasa Indonesia
 Bahasa Malay
 ไทย
ไทย Español
 Deutsch
 Български
 Français
 Tiếng Việt
 中文
中文 বাংলা
বাংলা हिन्दी
 Čeština
 Українська
 Română

