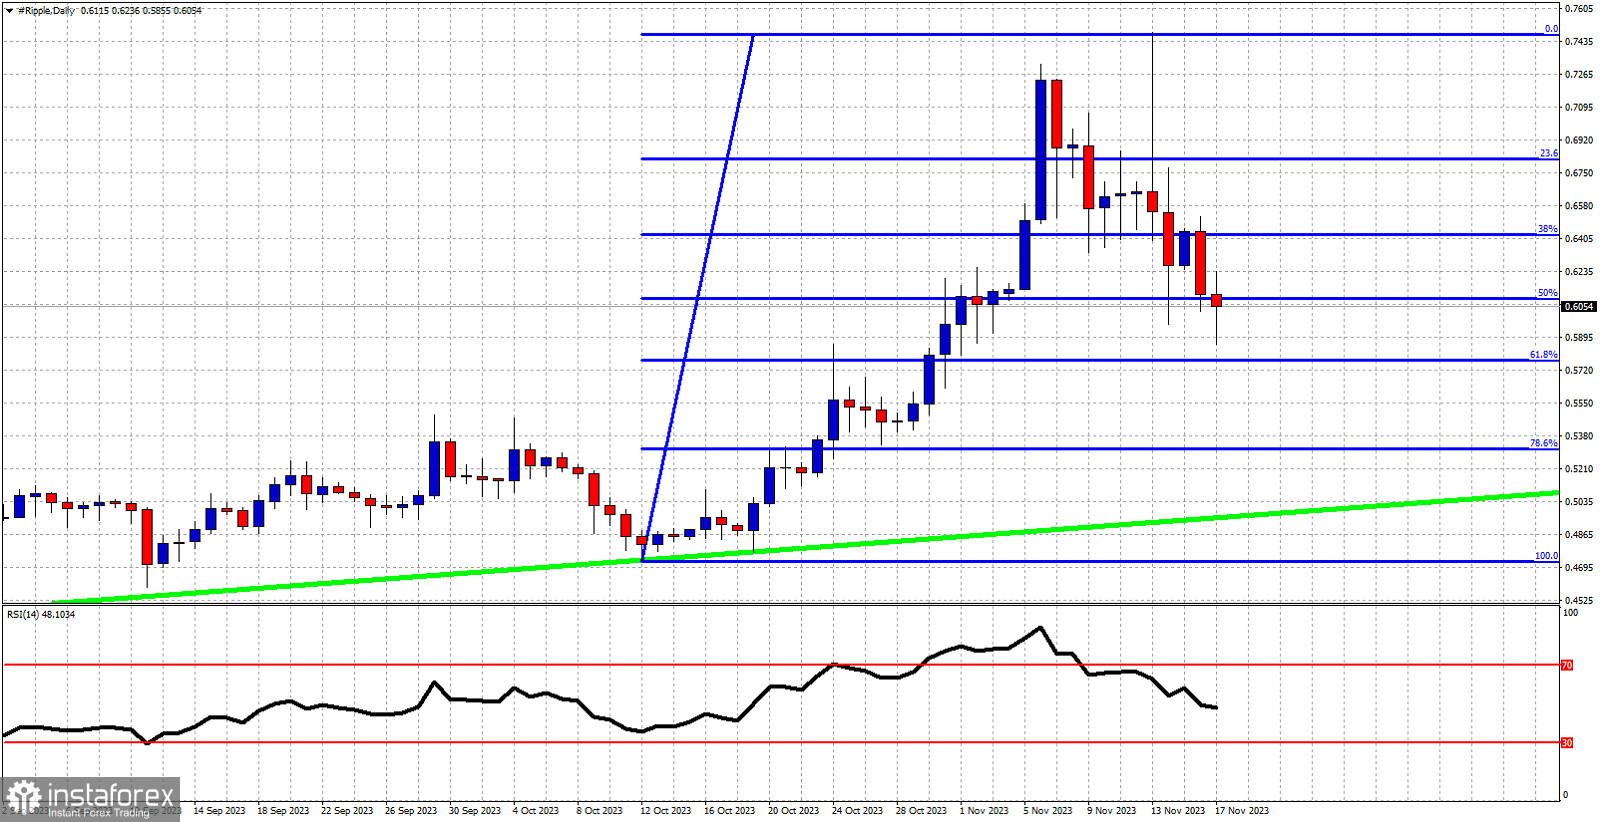
Blue lines- Fibonacci retracement levels
Green line- major support trend line
XRPUSD is trading around $0.60 after making a pull back close to $0.5855. Recently price made a new high with a failed candlestick forming a shooting star bearish candlestick pattern. We warned that a pull back will follow. Price from $0.74 has already retraced more than 50% of the entire upward move from $0.47. Key Fibonacci support is found at $0.5766. At the 61.8% retracement we usually see trend reversals. The RSI has still not reached oversold levels, but this is not necessary for an upward reversal. Price made a low close to the 61.8% retracement today. The next couple of sessions are very important as it will be decisive if we turn upwards or move lower towards the green major support trend line.
 English
 Русский
 Bahasa Indonesia
 Bahasa Malay
 ไทย
ไทย Español
 Deutsch
 Български
 Français
 Tiếng Việt
 中文
中文 বাংলা
বাংলা हिन्दी
 Čeština
 Українська
 Română

