Following the June FOMC meeting, it is likely that the downward trend will dominate the dynamics of the dollar and its DXY index in the coming weeks.
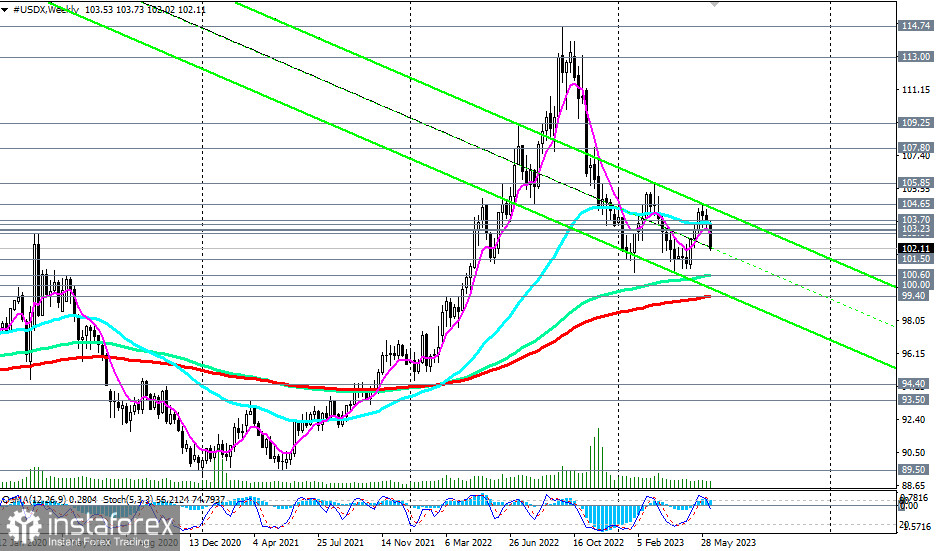
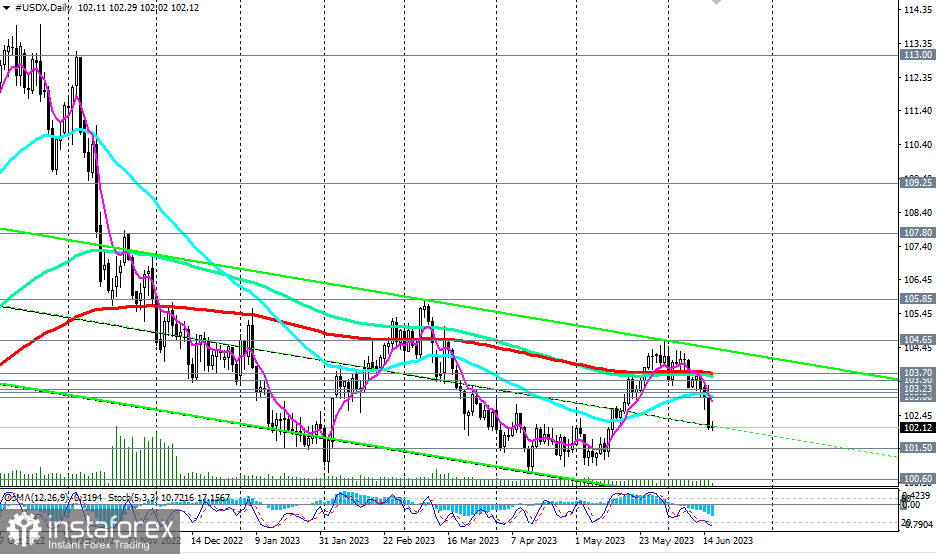
From a technical point of view, the DXY index (CFD #USDX in the MT4 terminal) continues to develop a downward trend towards key long-term support levels of 100.00 and 99.40 (200 EMA on the weekly chart) after breaking through the key medium-term support level of 103.70 (200 EMA on the daily chart). DXY remains in the zone of a long-term bullish market above these levels.

We also speculated that at the end of the trading week, one could expect profit-taking in short positions on the dollar and its strengthening, with the publication of the University of Michigan's preliminary Consumer Sentiment Index at 14:00 (GMT) being a potential driver.
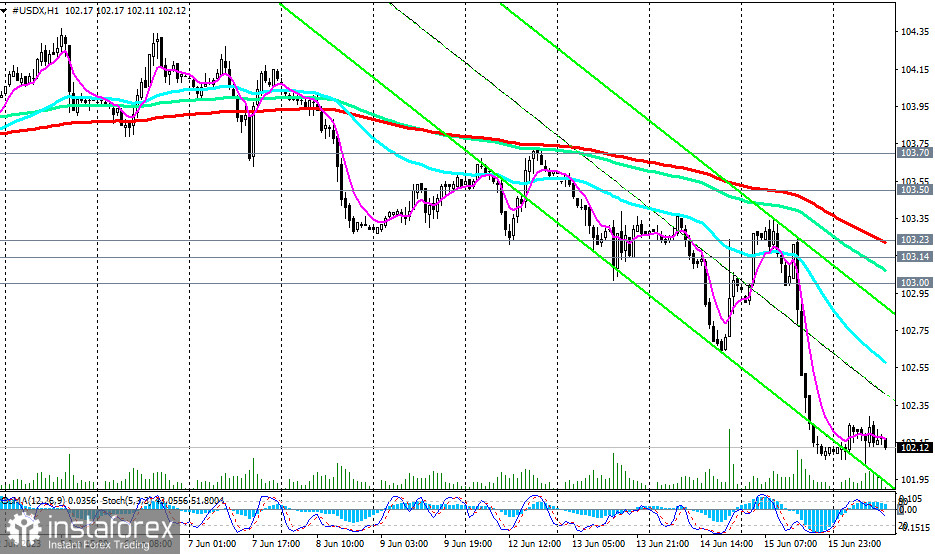
In this case, a breakout of today's high at 102.29 could serve as a signal to open long positions on the dollar with the target growth towards the nearest resistance level at 102.62 (200 EMA on the 15-minute chart), but in any case, not above the important resistance level of 103.00 (50 EMA on the daily chart).

The dollar remains under pressure, and below the resistance zone of 103.00, 103.14 (200 EMA on the 4-hour chart), 103.23 (200 EMA on the 1-hour chart), short positions remain preferable.
However, a breakout of this resistance zone will become a driver for the further growth of DXY. Long positions should be approached more carefully after breaking through the key medium-term resistance level of 103.70.
In the main scenario, a break of today's low at 102.02 will be a signal for increasing short positions on the DXY index.
A break of key support levels at 100.00 and 99.40 will bring DXY into a long-term bearish market zone.
Support levels: 102.00, 101.50, 101.00, 100.60, 100.00, 99.40, 99.00
Resistance levels: 102.62, 103.00, 103.14, 103.23, 103.50, 103.70, 104.00, 104.65, 105.00, 105.85, 106.00, 107.00, 107.80
 English
 Русский
 Bahasa Indonesia
 Bahasa Malay
 ไทย
ไทย Español
 Deutsch
 Български
 Français
 Tiếng Việt
 中文
中文 বাংলা
বাংলা हिन्दी
 Čeština
 Українська
 Română

