Overview :
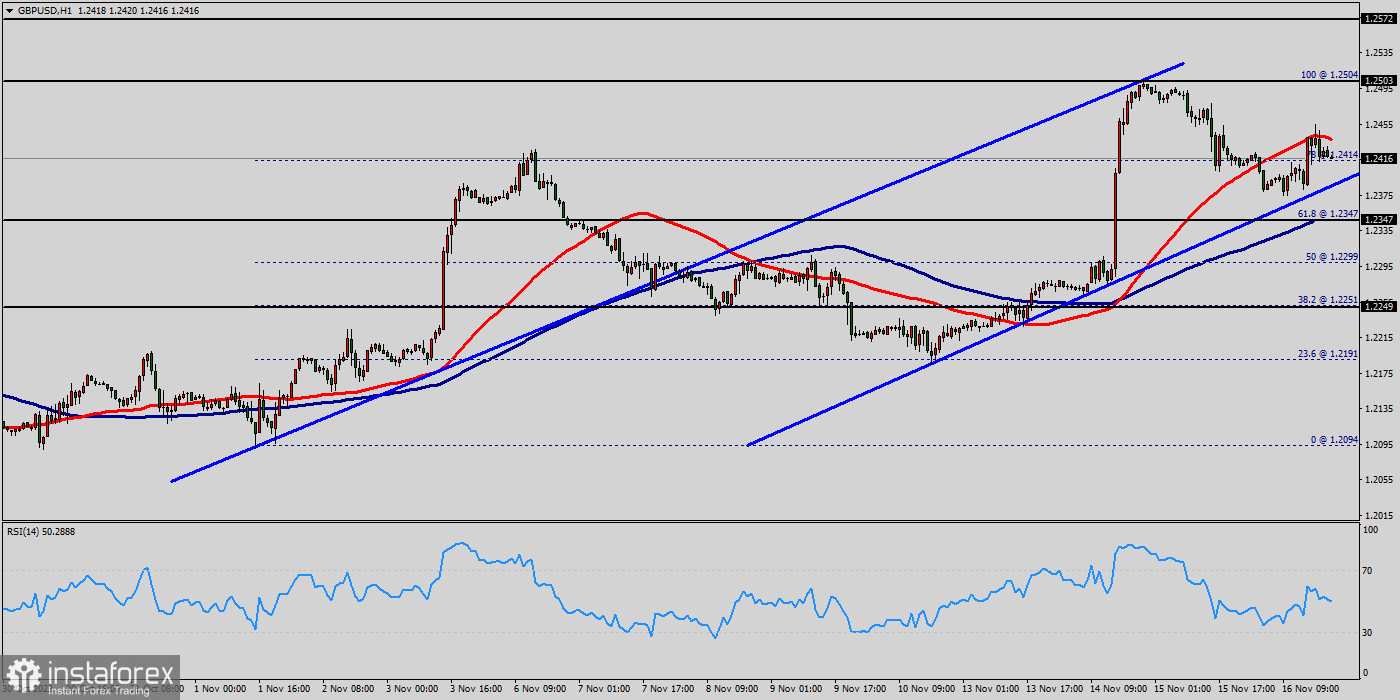
The GBP/USD pair will continue rising from the level of 1.2195 5today. So, the support is found at the level of 1.2347. Since the trend is above the 61.8% Fibonacci level, the market is still in an uptrend. Therefore, the GBP/USD pair is continuing with a bullish trend from the new support of 1.2153.
The current price is set at the level of 1.2423 that acts as a daily pivot point seen at 1.2434. Equally important, the price is in a bullish channel. According to the previous events, we expect the GBP/USD pair to move between 1.2495 and 1.2153. This would suggest a bullish market because the RSI indicator is still in a positive area and does not show any trend-reversal signs.
Therefore, strong support will be formed at the level of 1.2195 5providing a clear signal to buy with the target seen at 1.2460. If the trend breaks the resistance at 1.2460 (first resistance), the pair will move upwards continuing the development of the bullish trend to the level 1.2495 in order to test the daily resistance 2.
In the same time frame, resistance is seen at the levels of 1.2495 and 1.2500. The stop loss should always be taken into account for that it will be reasonable to set your stop loss at the level of 1.2326 (below the support 2). If the price of Pound Sterling is trading above 1.2583 then possibility of upside targets getting achieved is higher around the level of 1.2783.
The basic bullish trend is very strong on the GBP/USD pair, but the short term shows some signs of running out of steam. Nevertheless, a purchase could be considered as long as the price remains above 1.2461. Crossing the first resistance at 1.2583 would be a sign of a potential new surge in the price.
Buyers would then use the next resistance located at 1.2583 as an objective. Crossing it would then enable buyers to target 1.2583. Caution, a return to below 1.2583 would be a sign of a consolidation phase in the short-term basic trend. If this is the case, remember that trading against the trend may be riskier.
It would seem more appropriate to wait for a signal indicating reversal of the trend. In the very short term, the general bullish sentiment is not called into question, despite technical indicators being indecisive. All elements being clearly bullish market, it would be possible for traders to trade only long positions on the GBP/USD pair as long as the price remains well above the price of 1.2461.
A bullish break in this resistance would boost the bullish momentum. The buyers could then target the resistance located at 1.2583. This suggests that the pair will probably go up in coming hours. If the trend is able to break the level of 1.2583 (double top), then the market will call for a strong bullish market towards the objective of 1.2615 this week.
 English
 Русский
 Bahasa Indonesia
 Bahasa Malay
 ไทย
ไทย Español
 Deutsch
 Български
 Français
 Tiếng Việt
 中文
中文 বাংলা
বাংলা हिन्दी
 Čeština
 Українська
 Română

