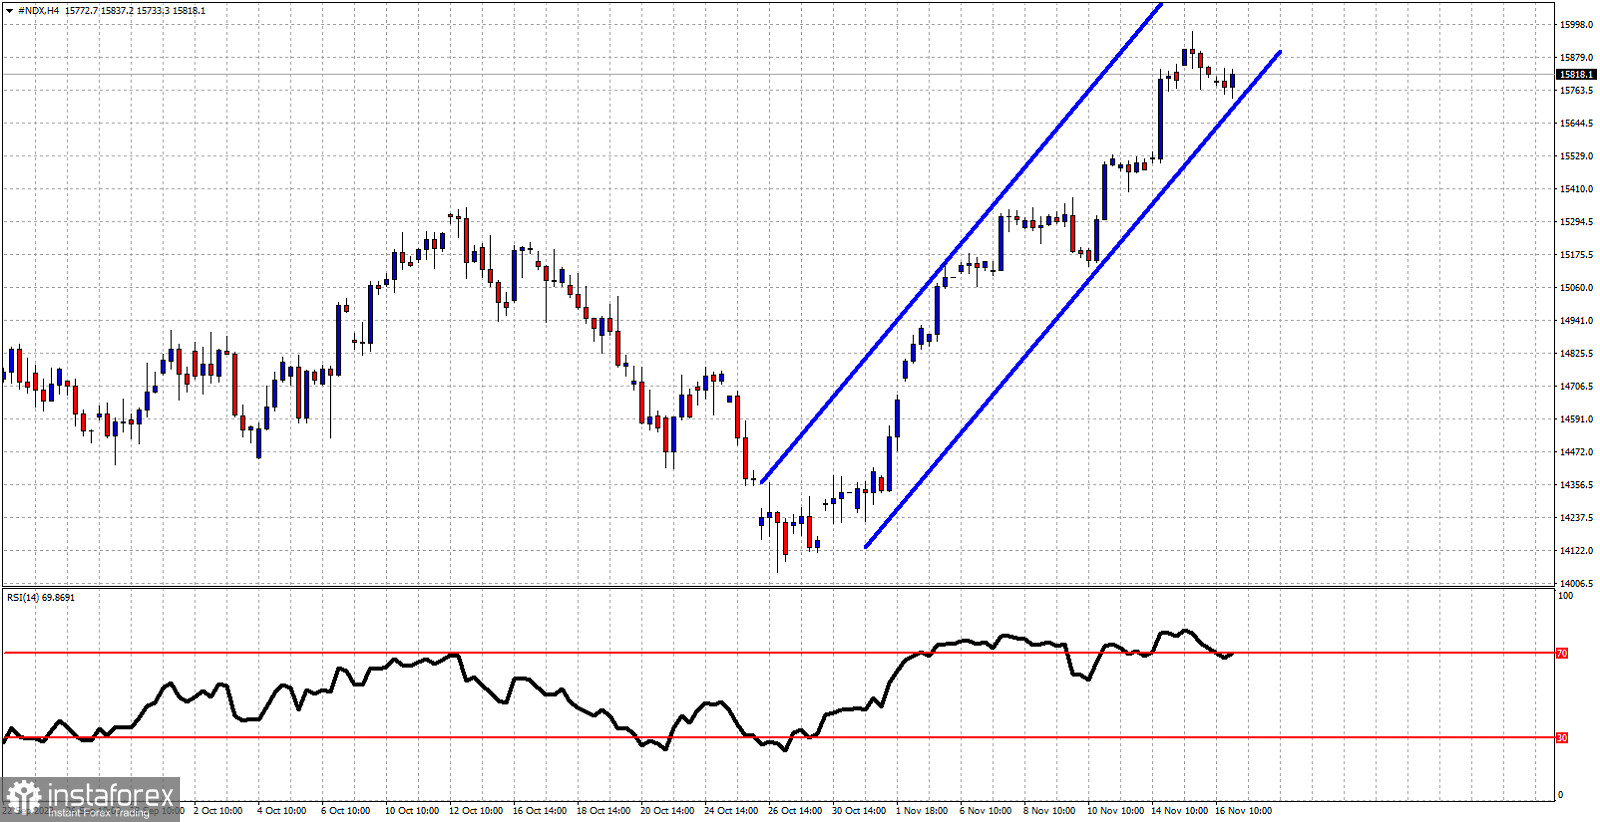
Blue lines- bullish channel
NASDAQ is trading around 15,800. Price has formed a bullish channel and is making higher highs and higher lows inside it. Bulls remain in full control of the short-term trend. The RSI has entered overbought levels but so far there are no bearish divergence signs. The lower channel boundary provides support at 15,700. As long as price holds above this level, short-term trend remains bullish. A new higher high is very possible towards 16,000. A break below 15,700 will initiate a pull back towards 15,300.
 English
 Русский
 Bahasa Indonesia
 Bahasa Malay
 ไทย
ไทย Español
 Deutsch
 Български
 Français
 Tiếng Việt
 中文
中文 বাংলা
বাংলা हिन्दी
 Čeština
 Українська
 Română

