Technical Market Outlook:
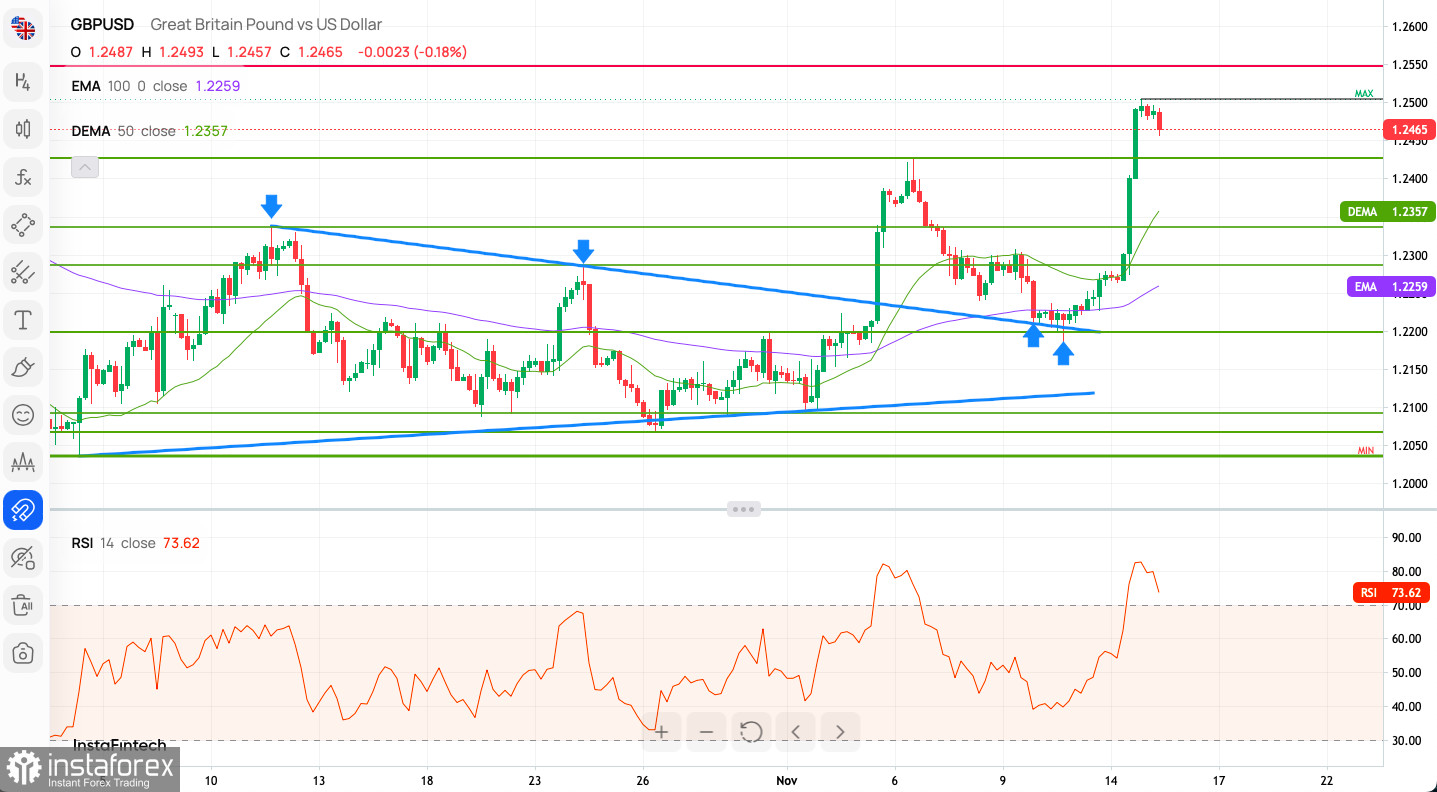
The GBP/USD pair has been seen rallying 2.6% from the last local low and hit the level of 1.2504. The next key technical resistance and the target for bulls is seen at the level of 1.2550. The intraday technical support is seen at 1.2427. The momentum on the H4 time frame chart hit the extremely overbought conditions, so pull-back can happen any time now. Please notice, that the mid-term outlook remains bearish due to the Bearish Cross of 50 and 100 DMA on the daily time frame chart, so as long as the level of 1.2550 (long-term technical resistance) is not clearly violated, the down trend might be resumed soon.

Weekly Pivot Points:
WR3 - 1.2615
WR2 - 1.2522
WR1 - 1.2374
Weekly Pivot - 1.2281
WS1 - 1.2133
WS2 - 1.2040
WS3 - 1.1892
Trading Outlook:
The weekly time frame chart shows the Bullish Engulfing candlestick pattern was made during the breakout above the level of 1.2340, so the bulls are in charge of the market and they are pushing the price higher. The market already trades above 50 WMA and is heading towards 100 WMA seen at 1.2504. On the other hand, any sustained breakout below the key long term technical support seen at the level of 1.1802 would dramatically increase the chances of another leg down towards the level of 1.1494.
 English
 Русский
 Bahasa Indonesia
 Bahasa Malay
 ไทย
ไทย Español
 Deutsch
 Български
 Français
 Tiếng Việt
 中文
中文 বাংলা
বাংলা हिन्दी
 Čeština
 Українська
 Română

