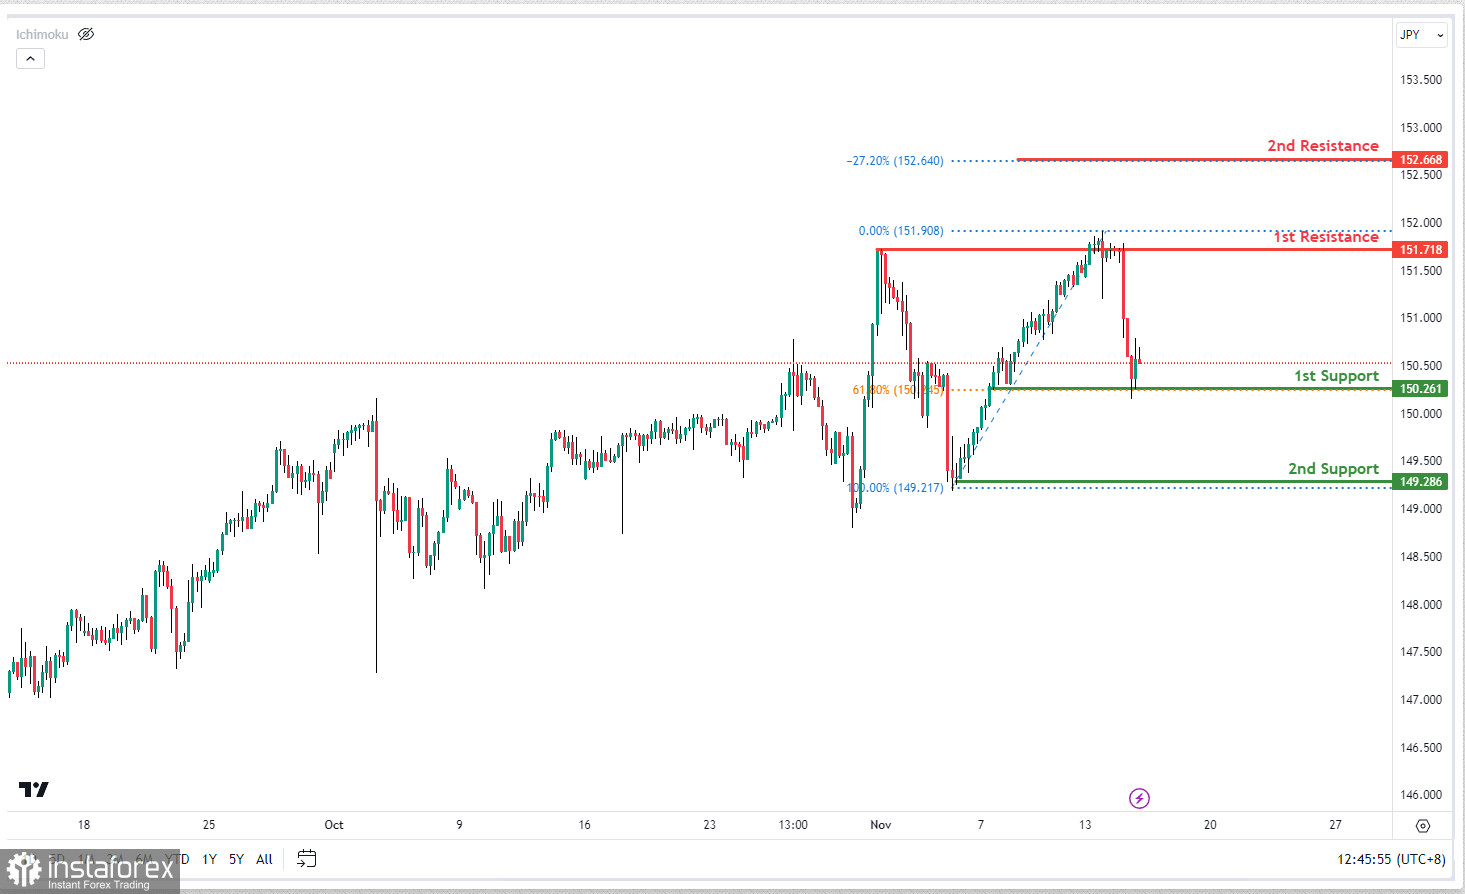
The USD/JPY chart currently shows bullish momentum, indicating a potential bounce from the 1st support at 150.26, which coincides with the 61.80% Fibonacci Retracement level. The 2nd support at 149.28 is a swing low support, reinforcing its significance. On the resistance side, the 1st resistance at 151.71 is a multi-swing high resistance, likely to attract selling interest. The 2nd resistance at 152.66 corresponds to the -27% Fibonacci Extension level, indicating a potential zone for selling pressure. Overall, there's potential for a bullish bounce towards the 1st resistance after finding support at the 1st support level.
 English
 Русский
 Bahasa Indonesia
 Bahasa Malay
 ไทย
ไทย Español
 Deutsch
 Български
 Français
 Tiếng Việt
 中文
中文 বাংলা
বাংলা हिन्दी
 Čeština
 Українська
 Română

