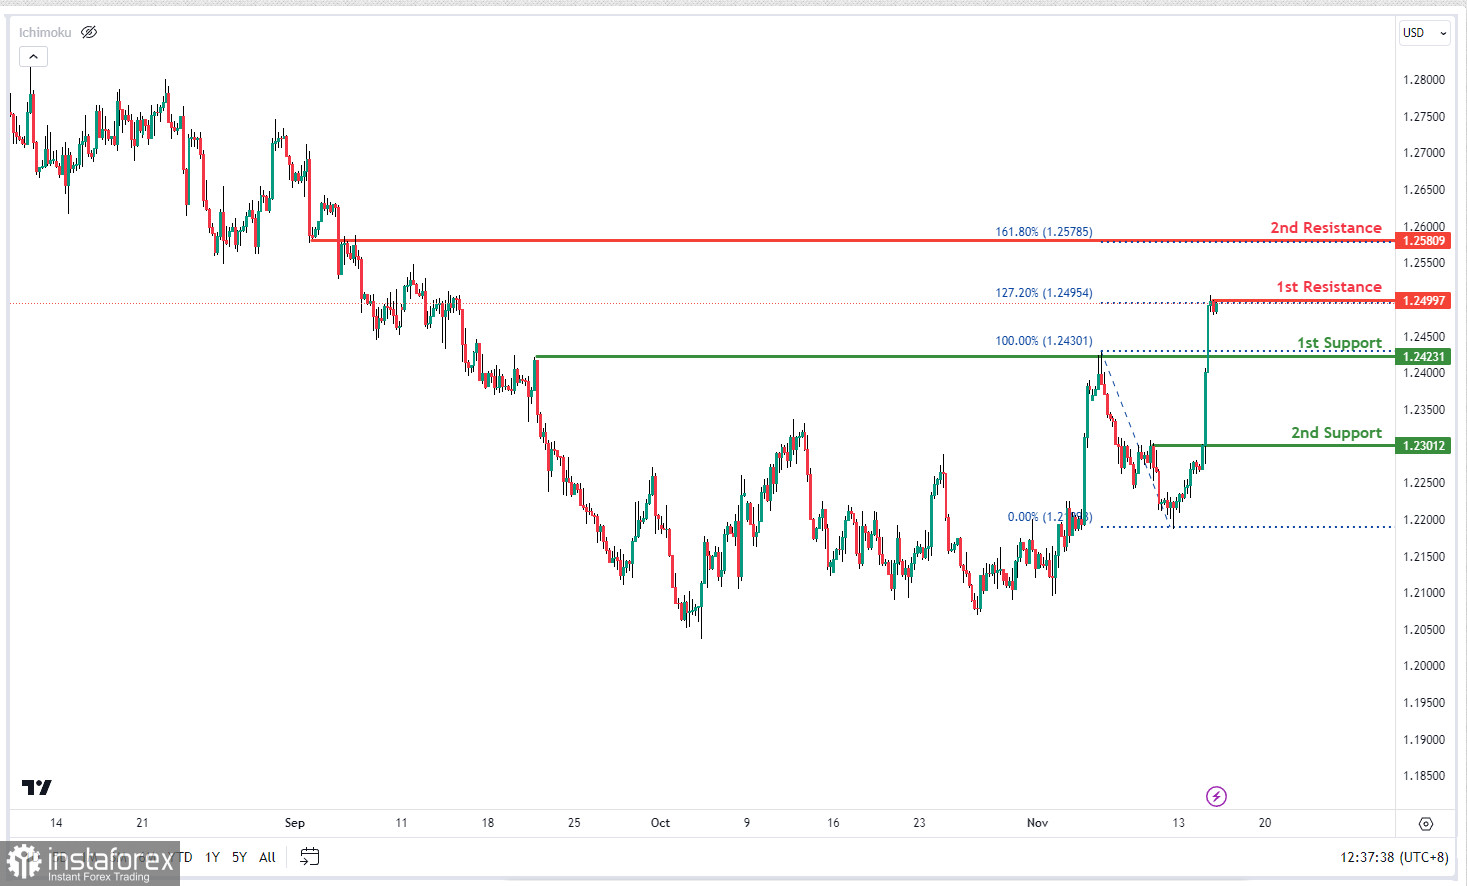
The GBP/USD chart currently shows bullish momentum but might experience a short-term dip towards the 1st support at 1.2423, expected to attract buyers. The 2nd support at 1.2301 is another pullback support, adding to its significance. On the resistance side, the 1st resistance at 1.2499 aligns with the 127.20% Fibonacci Extension level, suggesting potential selling pressure. The 2nd resistance at 1.2580 is an overlap resistance, coinciding with the 161.80% Fibonacci Extension level, indicating a point of increased selling interest during a potential rise. Overall, a short-term drop towards the 1st support may precede a bounce towards the 1st resistance.
 English
 Русский
 Bahasa Indonesia
 Bahasa Malay
 ไทย
ไทย Español
 Deutsch
 Български
 Français
 Tiếng Việt
 中文
中文 বাংলা
বাংলা हिन्दी
 Čeština
 Українська
 Română

