GBP/USD
Analysis:
Since September of last year, the main trend of the British pound exchange rate has been determined by an ascending trend algorithm. In the recent past, starting in May, the price has formed an intermediate correction in the form of a range, which remains incomplete. The quotes have reached the lower boundary of the significant time frame's intermediate resistance zone.
Forecast:
At the beginning of the upcoming week, pressure on the resistance zone can be expected, with further price fluctuations of the British pound moving into a sideways range. Towards the end of the week, the probability of a change in direction and a decrease in quotes up to the support boundary increases.
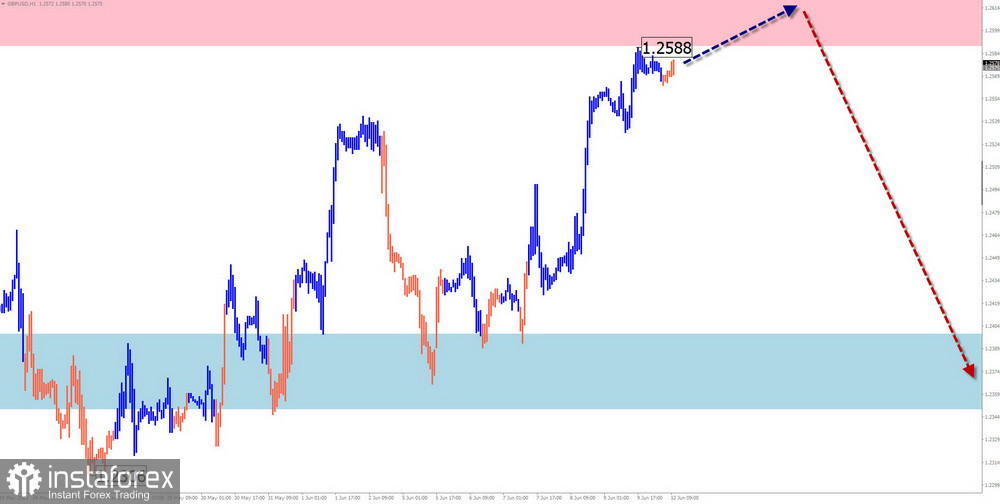
Potential Reversal Zones:
Resistance:
- 1.2590/1.2640
Support:
- 1.2400/1.2350
Recommendations:
Buy: There are no conditions for such transactions in the market.
Sell: They can be used in trading after reversal signals near the resistance zone appear.
AUD/USD
Analysis:
Within the dominant ascending wave of the Australian dollar's major chart, an ongoing descending wave structure, which remains incomplete today, has replaced a correction. Its recent segment since May 31st is directed upwards, with its wave level not exceeding the retracement size. At the time of analysis, the quotes are approaching a strong resistance zone on the daily scale.
Forecast:
After attempts to pressure the resistance zone in the coming days, a transition of fluctuations into a sideways range can be expected, followed by a reversal and a decrease toward the support zone boundaries. The highest volatility is likely towards the end of the week.
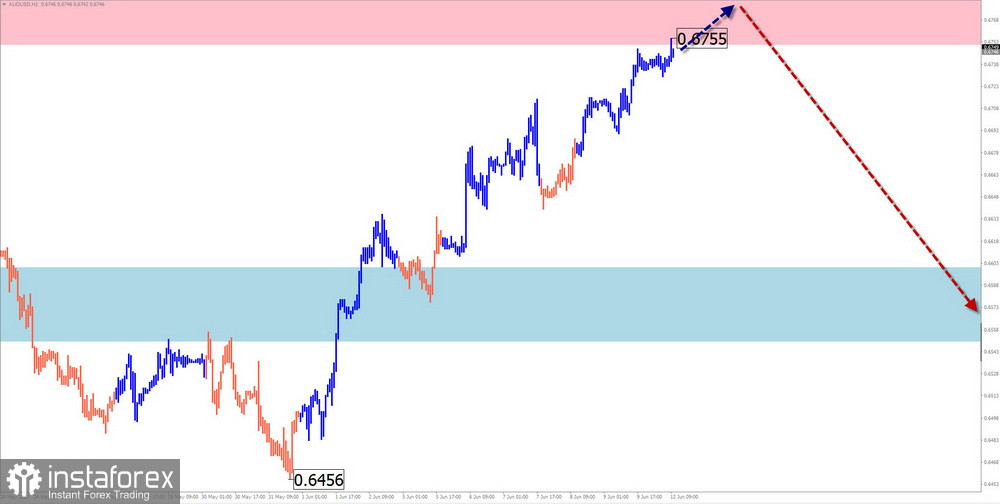
Potential Reversal Zones:
Resistance:
- 0.6750/0.6800
Support:
- 0.6600/0.6550
Recommendations:
Buy: The potential for such transactions has been exhausted.
Sell: They can be used in short-term trading transactions after the appearance of reversal signals.
USD/CHF
Analysis:
The unfinished wave of the Swiss franc's major chart has led downward since November last year. From the upper boundary of a strong potential reversal zone, the quotes have formed an upward price retracement over the past month, which remains unformed. Its potential does not exceed the correction level.
Forecast:
During the upcoming days, pressure on the support zone is likely. A breakthrough at the lower boundary is unlikely. The resumption of price growth can be expected in the second half of the week. Increased volatility may coincide with the release of important economic data.
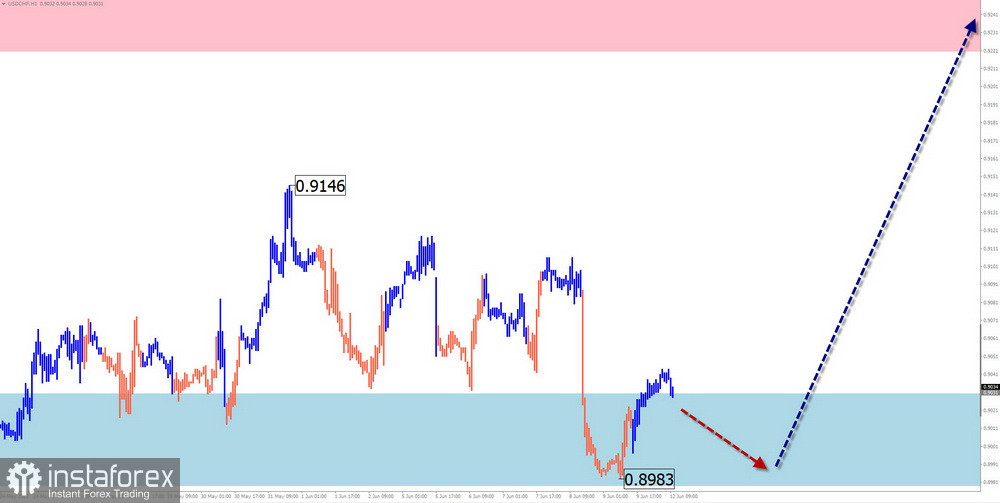
Potential Reversal Zones:
Resistance:
- 0.9220/0.9270
Support:
- 0.9030/0.8980
Recommendations:
Sell: They carry high risk and may lead to a loss of funds.
Buy: They can be used in trading when corresponding reversal signals appear near the support zone.
EUR/JPY
Analysis:
The EUR/JPY pair fluctuations fit into the ascending wave algorithm starting on March 24th. Since the beginning of May, the price has formed a corrective flat. At the time of analysis, its structure did not indicate completion. Over the past two weeks, the price has formed a flat corridor within two price figures.
Forecast:
At the beginning of the week, pressure may be in the resistance zone. A brief breakthrough of its upper boundary is included. Then, a change in direction can be expected, with a decrease in price towards the calculated support levels.
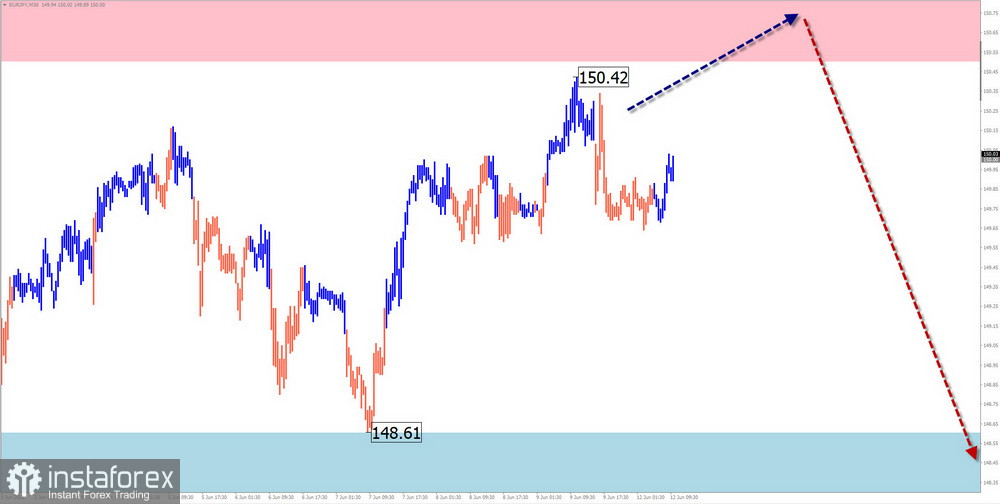
Potential reversal zones:
Resistance:
- 150.50/151.00.
Support:
- 148.60/148.10.
Recommendations:
Buy: fractional lots are possible within individual trading sessions.
Sell: can be used in trading after the appearance of confirmed reversal signals near the resistance zone.
EUR/GBP
Analysis:
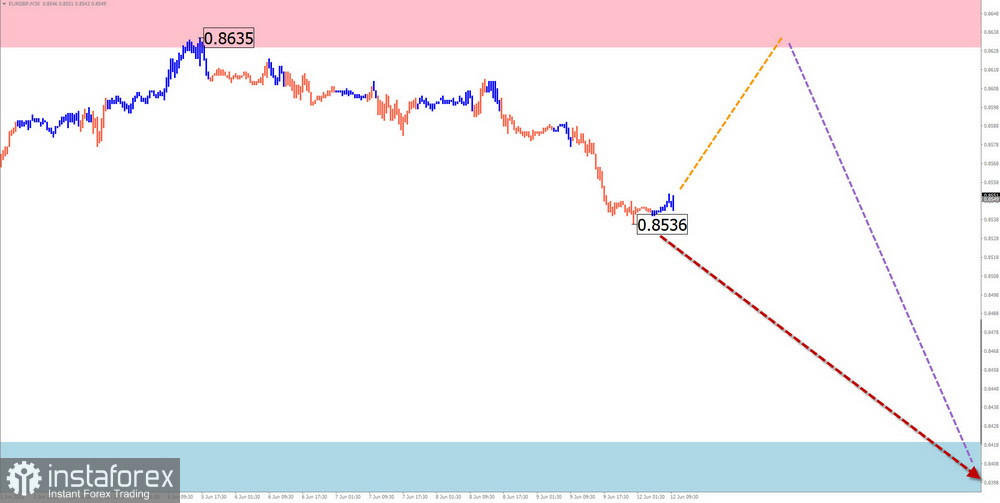
On the EUR/GBP cross chart, the formation of a bearish wave that started in September of last year continues. It is predominantly forming within a sideways range. The middle part of the wave (B) is incomplete in its structure. Projections drawn from the extremes of the wave indicate a stretched, flat shape.
Forecast:
After a possible price rebound at the beginning of the next week, a gradual decline of the pair's quotes toward the levels of the calculated support zone should be expected. The second half of the week is expected to be more volatile.
Potential reversal zones:
Resistance:
- 0.8630/0.8680.
Support:
- 0.8420/0.8370.
Recommendations:
Buy: This carries a high degree of risk and has low potential.
Sell: can be used for trading after confirmed reversal signals appear near the resistance zone.
US Dollar Index
Analysis:
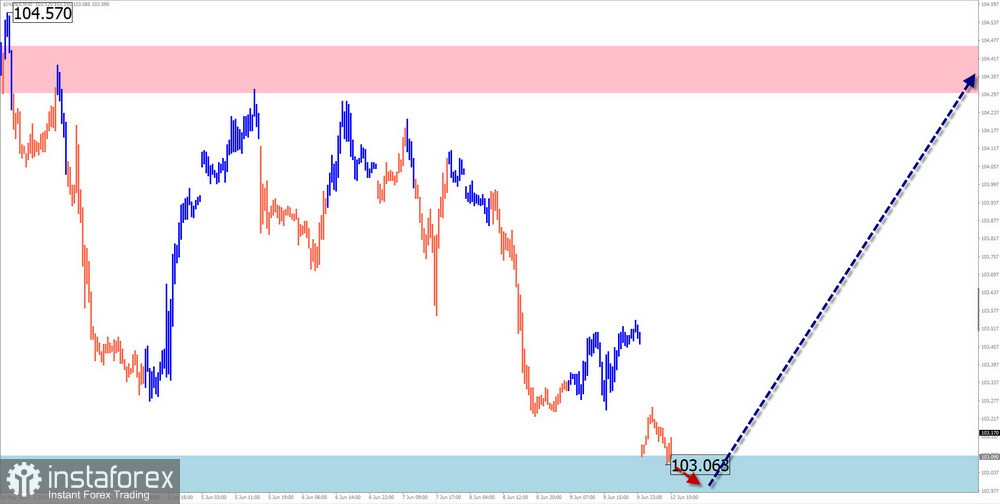
An incomplete wave model is forming a corrective countermove within the dominant bearish trend on the dollar index chart. It has been counting from the beginning of February and, at the time of analysis, does not indicate completion. Before the final upward surge, the chart shows an intermediate retracement.
Forecast:
In the first half of the upcoming week, a continuation of the sideways movement with an overall downward vector can be expected for the index. Towards the end of the week, a change in direction and an increase in quotes from the support zone can be anticipated. When changing direction, a brief breakthrough of the lower boundary of the support zone cannot be ruled out.
Potential reversal zones:
Resistance:
- 104.30/104.45.
Support:
- 103.10/102.95.
Recommendations:
The temporary weakening of the US dollar positions is nearing its end. After the appearance of reversal signals on the chart, the optimal tactic for the upcoming week will be to focus on selling national currencies in major pairs.
Explanation: In simplified wave analysis (SWA), all waves consist of 3 parts (A-B-C). The last incomplete wave is analyzed on each timeframe. Dotted lines represent expected movements.
Attention: The wave algorithm does not consider the duration of movements in time for the instruments!
 English
 Русский
 Bahasa Indonesia
 Bahasa Malay
 ไทย
ไทย Español
 Deutsch
 Български
 Français
 Tiếng Việt
 中文
中文 বাংলা
বাংলা हिन्दी
 Čeština
 Українська
 Română

