Analysis of macro reports:

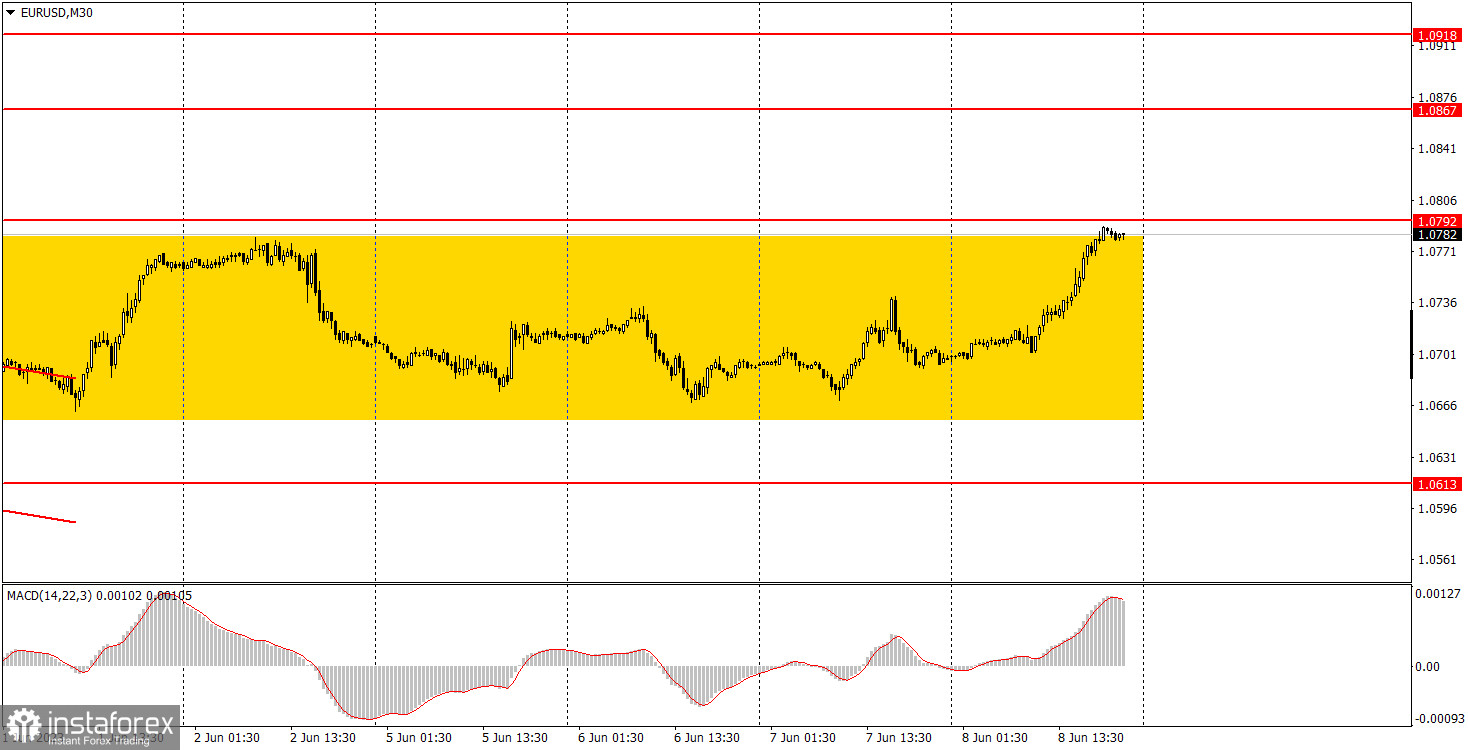
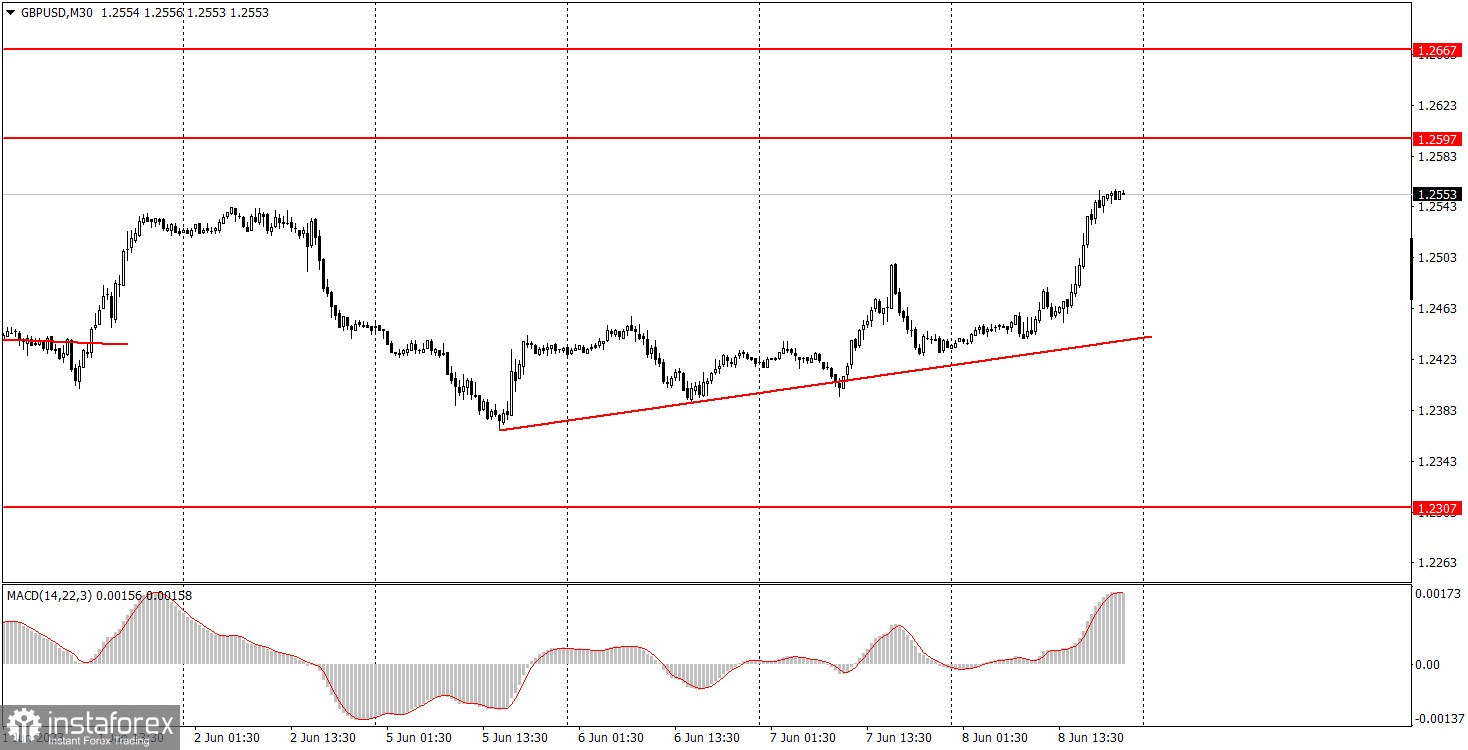
The macroeconomic calendar will be empty on Friday. So, traders will have nothing to draw their attention to within the day. One event is scheduled for today, but it will hardly affect the market. EUR/USD has been trading in a sideways channel, or rather in a limited price channel. A bounce off 1.0792 may trigger a fall steeper than the one yesterday without any reason for that. GBP/USD has recently been on the rise, but its growth has been chaotic and illogical.
Analysis of fundamental events:

ECB Vice President Luis de Guindos will deliver a speech on Friday. It will be his second speech this week. The ECB will likely continue increasing interest rates. This month, the benchmark rate is expected to be raised by another 25 basis points. That is why each new speech of the ECB official hardly affects trader sentiment.
Final thoughts:
In light of an empty macroeconomic calendar on Friday, we anticipate low volatility within the day. Yesterday's movement of both currency pairs looks strange as they both were in a strong trend for almost no reason. All in all, the pairs may show weakness today equal to yesterday's strength.
Basic principles of the trading system:
1) The strength of a signal depends on the time period during which the signal was formed (a rebound or a breakout). The shorter this period, the stronger the signal.
2) If two or more trades are opened at some level following false signals, i.e. those signals that do not lead the price to the Take Profit level or the nearest target levels, any consequent signals near this level should be ignored.
3) During a flat market, any currency pair may generate a lot of false signals or no signals at all. In any case, a flat market is not the best condition for trading.
4) Trades are opened in the time period between the beginning of the European session and the middle of the American session when all positions should be closed manually.
5) We can pay attention to the MACD signals in the 30M time frame only if there is good volatility and a definite trend confirmed by a trend line or a trend channel.
6) If two key levels are too close to each other (about 5-15 pips), they make a support or resistance area.
How to interpret charts:
Support and resistance can serve as targets when buying or selling. You can place a Take Profit near them.
Red lines are channels or trend lines that display the current trend and show which direction is better to trade.
MACD indicator (14,22,3) is a histogram and a signal line showing when it is better to enter the market when they cross. This indicator is better to be used in combination with trend channels or trend lines.
Important speeches and reports that are always reflected in the economic calendars can greatly influence the movement of a currency pair. Therefore, during such events, it is recommended to trade as carefully as possible or exit the market in order to avoid a sharp price reversal against the previous movement.
Beginner traders should remember that every trade cannot be profitable. The development of a reliable strategy and money management is the key to success in long-term trading.
 English
 Русский
 Bahasa Indonesia
 Bahasa Malay
 ไทย
ไทย Español
 Deutsch
 Български
 Français
 Tiếng Việt
 中文
中文 বাংলা
বাংলা हिन्दी
 Čeština
 Українська
 Română

