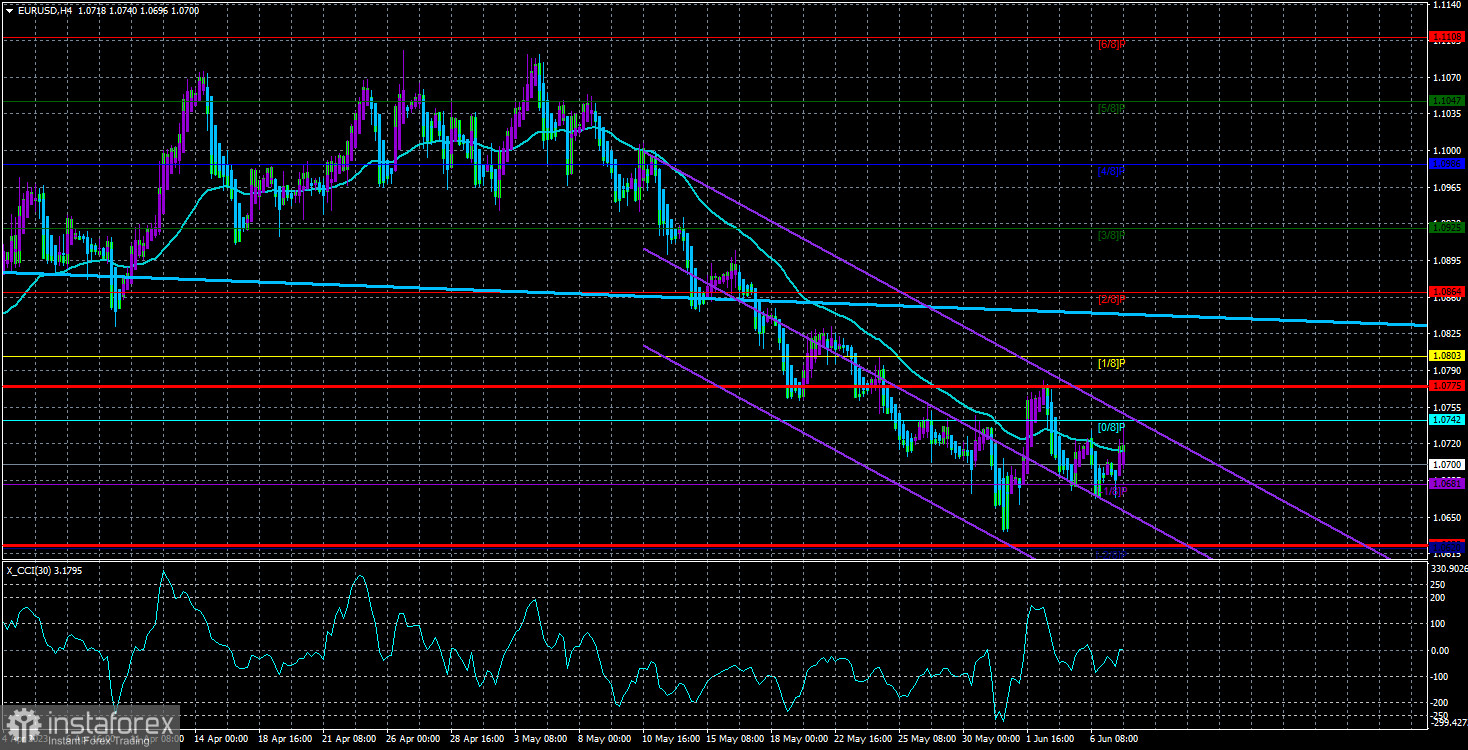
The EUR/USD currency pair was trading weakly again on Wednesday without strong exchange rate changes. In other words, the movements were either weak or absent altogether. They were absent in the same way as the fundamental background. The pair has been in a limited price range for more than a week, as is clearly seen in the illustration above. This is not a flat, nor is it a side channel, but it is obvious that the pair has been practically immobilized lately.
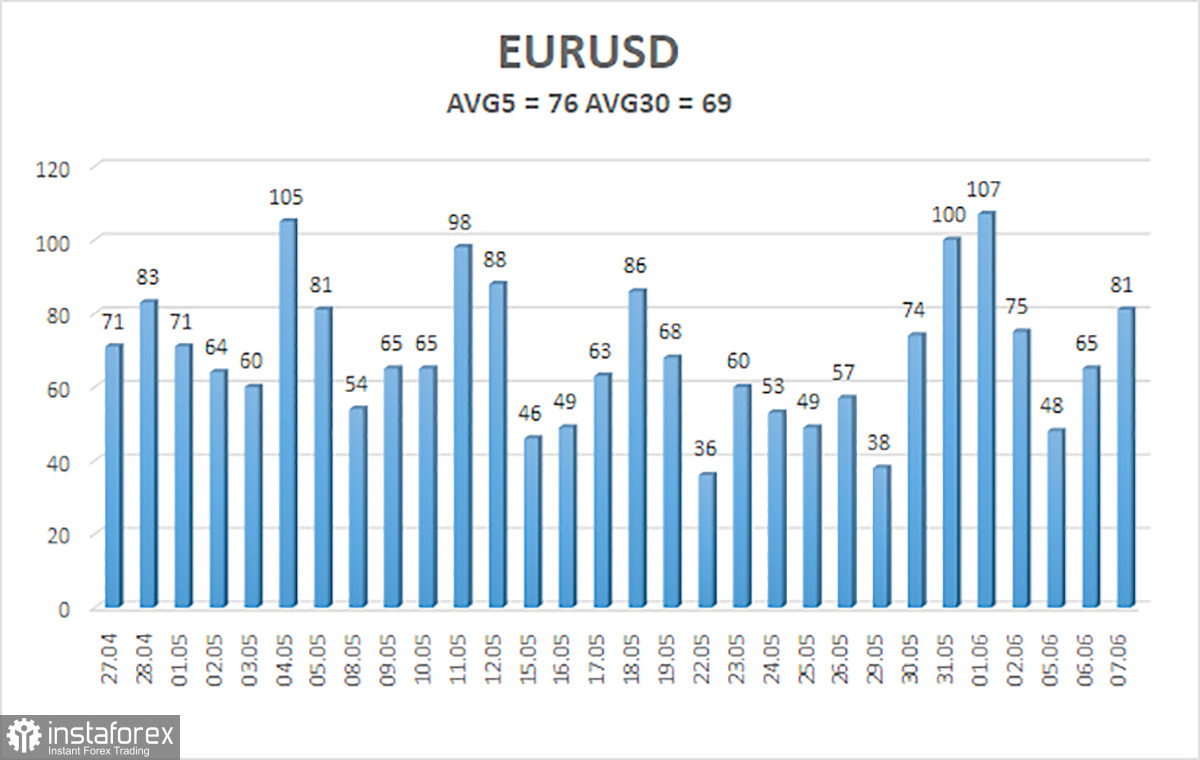
We also want to draw attention to the weak volatility. According to our calculations outlined in the illustration below, the average volatility over the last 30 working days is less than 70 points. With an average value of 60 points, the pair is quite difficult to trade, even on the youngest TF intraday. If the volatility is weak, then you can only trade in the medium term, that is, each transaction should be open for at least a few days. Only in this case, you count on a more or less tangible profit. And now the pair is also immobilized, so no matter how long you wait, the course does not change. In general, there are more attractive times for trading.
Regarding the fundamental background, nothing is notable from the first three days of the week. The ISM Non-Manufacturing Purchasing Managers' Index in the United States, published on Monday and triggering a market reaction of 50 points, remains the most significant report. On Tuesday and Wednesday, there was nothing noteworthy to pay attention to. Of course, there were routine speeches by representatives of the ECB (Schnabel, Lagarde, and Knot), but they did not contain anything important or interesting. Plus, it should be understood that another ECB meeting is approaching, and a "quiet period" is in effect, during which central bank representatives are not allowed to comment on monetary policy.
Therefore, we can only rely on macroeconomic statistics before the ECB and Fed meetings. Looking at the calendar for this week, we see that we have to "digest" the GDP in the European Union and the jobless claims in the United States. These two reports could be more likely to attract the market's attention.
The energy crisis has been overcome.
On Monday, during the European Parliament's Committee on Economic Affairs hearings, ECB President Christine Lagarde made a speech. We are mentioning it only now because Lagarde did not disclose anything related to monetary policy. And all other matters are currently secondary to the market. Nevertheless, it should be noted that the ECB called on the governments of EU countries to end their support for the population in overcoming the energy crisis. Recall that last year, when oil and gas prices sharply rose, the EU government decided to compensate part of the energy costs for all citizens of the bloc. However, in 2023, oil and gas prices will have fallen, so various subsidies and grants are no longer needed. Moreover, the additional money in the pockets of Europeans fuels inflation, which the ECB is fighting against, according to Christine Lagarde. "The governments of EU countries should phase out the relevant support measures to avoid increasing inflationary pressures. Otherwise, the ECB will have to intensify monetary pressure," Lagarde said.
In turn, the Commission stated that it does not intend to extend the "crisis" measures, as gas prices have stabilized. By the next winter, when there will be a new gas and energy consumption surge, the European Union will be much better prepared than in winter 2022. Thus, inflation in the EU will continue to slow until the end of 2023, significantly reducing the likelihood of additional tightening of the ECB's monetary policy. We still believe that the European regulator will raise rates another 1-2 times by 0.25%, and that will conclude the tightening program. Inflation in some Eurozone countries is already approaching the target level. Further rate hikes should only be considered in countries with high inflation, but that option is not feasible for the Alliance.

The average volatility of the euro/dollar currency pair for the last five trading days as of June 8th is 76 points, characterized as "average." Thus, we expect the pair to move between the levels of 1.0623 and 1.0775 on Thursday. A reversal of the Heiken Ashi indicator's backdown would indicate a possible resumption of a downward movement.
Nearest support levels:
S1 - 1.0681
S2 - 1.0620
Nearest resistance levels:
R1 - 1.0742
R2 - 1.0803
R3 - 1.0864
Trading recommendations:
The EUR/USD pair continues to trade below the moving average line. Short positions should be considered with a target of 1.0620 in case the price bounces off the moving average. However, there is also a high probability of a flat market. Long positions will become relevant only if the price reverses above the moving average line, with targets at 1.0775 and 1.0803.
Explanation of illustrations:
Linear regression channels - help determine the current trend. If both point in the same direction, it indicates a strong trend.
Moving average line (settings 20.0, smoothed) - determines the short-term trend and the direction in which trading should be conducted.
Murray levels - target levels for movements and corrections.
Volatility levels (red lines) - probable price channel in which the pair will move in the next 24 hours, based on current volatility indicators.
CCI indicator - its entry into the oversold area (below -250) or overbought area (above +250) indicates an approaching trend reversal in the opposite direction.
 English
 Русский
 Bahasa Indonesia
 Bahasa Malay
 ไทย
ไทย Español
 Deutsch
 Български
 Français
 Tiếng Việt
 中文
中文 বাংলা
বাংলা हिन्दी
 Čeština
 Українська
 Română

