 English
  Русский
 Bahasa Indonesia
 Bahasa Malay
 ไทย
ไทย Español
 Deutsch
 Български
 Français
 Tiếng Việt
 中文
中文 বাংলা
বাংলা हिन्दी
 Čeština
 Українська
 Română

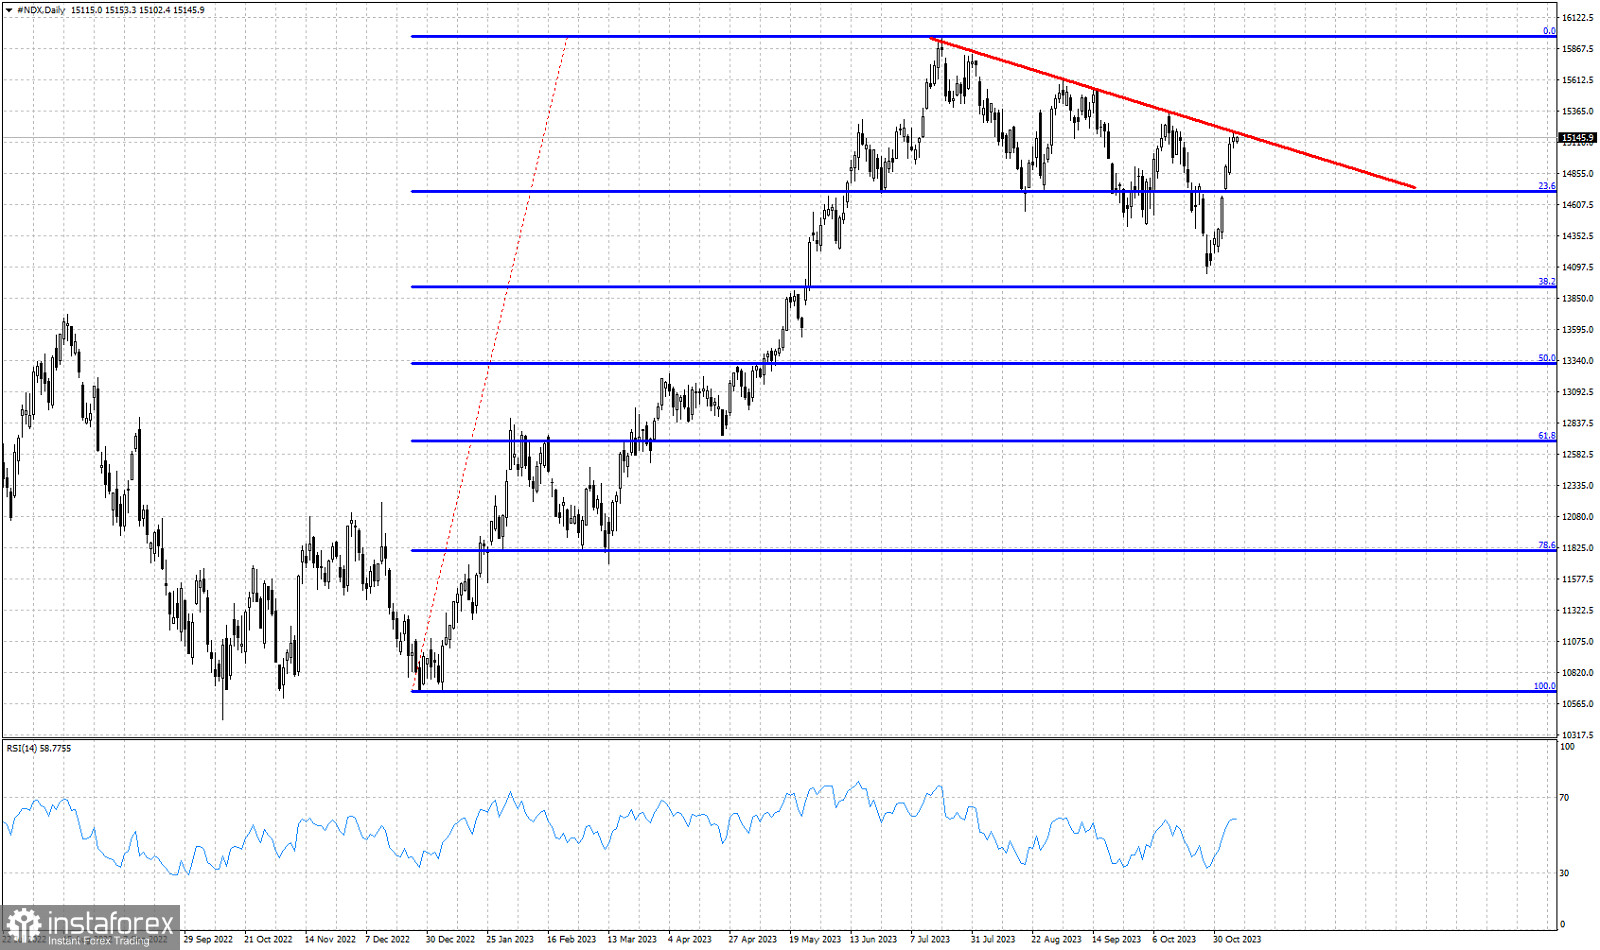
Red line- resistance
Blue lines- Fibonacci retracement levels
NASDAQ is found at a very crucial price level where bulls challenge the red downward sloping resistance trend line. The trend line provides resistance at 15,185 and a daily close above this level would be a positive sign. Price has already retraced almost 38% of the entire rise. The index has made an impressive almost vertical rise from recent low at 14,045. Short-term trend is controlled by bulls as price is making higher highs and higher lows in the 4 hour chart. The RSI is far from overbought levels, implying there is more upside potential if price continues forming higher highs and higher lows.