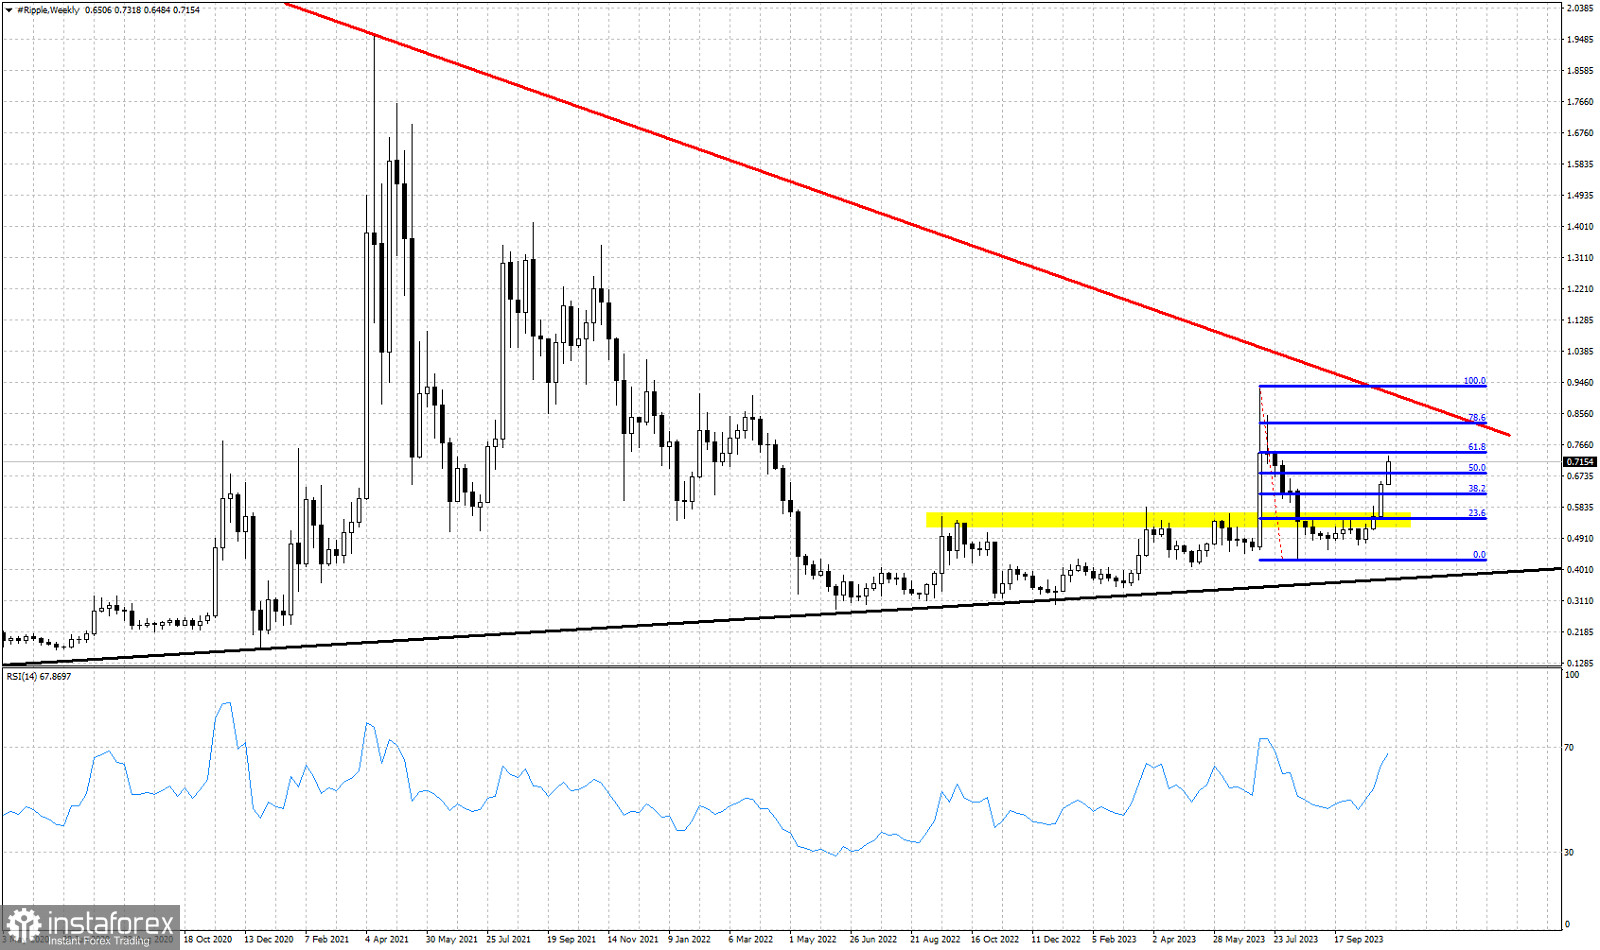
Red line- major resistance trend line
Blue lines- Fibonacci retracement levels
Yellow rectangle- resistance (broken)
Black line- major support trend line
XRPUSD is currently trading above $0.70. Recently XRPUSD provided us with a bullish reversal signal when price broke above the horizontal resistance area around $0.55. Short-term trend is bullish as price is making higher highs and higher lows. Key support trend lines were respected and now price is breaking above Fibonacci retracement resistance levels. XRPUSD has broken also above the 50% Fibonacci retracement level and is heading towards our next target at $0.73 where we find the key 61.8% retracement level. With a higher low at $0.43, without breaking below the black support trend line, XRPUSD continues to have the potential to test the red major downward sloping trend line.
 English
 Русский
 Bahasa Indonesia
 Bahasa Malay
 ไทย
ไทย Español
 Deutsch
 Български
 Français
 Tiếng Việt
 中文
中文 বাংলা
বাংলা हिन्दी
 Čeština
 Українська
 Română

