When to open long positions on EUR/USD:
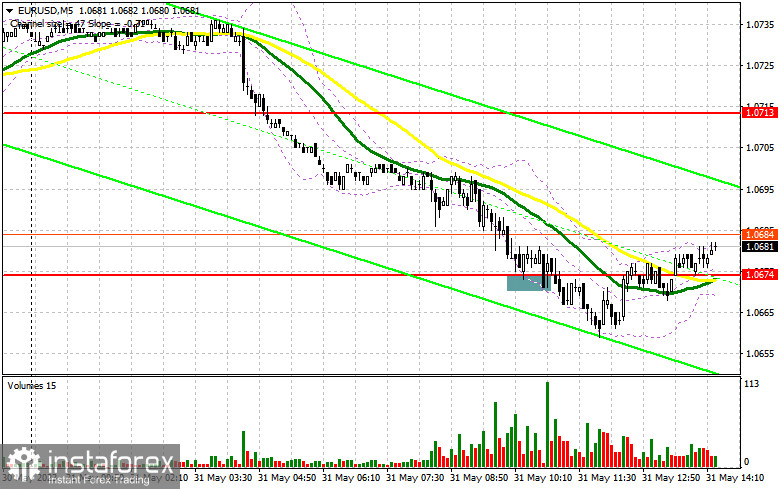
In my morning article, I turned your attention to 1.0674 and recommended making decisions with this level in focus. Now, let's look at the 5-minute chart and figure out what actually happened. A decline and a false breakout of this level gave an excellent entry point into long positions. However, the pair failed to climb. As a result, it was necessary to lock in profits. In the afternoon, the technical outlook was revised.

When to open long positions on EUR/USD:
The euro kept dropping despite a decrease in Germany's unemployment rate. Germany's inflation figures may support the euro only if the reading rises. Given that Fed members Michelle Bowman and Patrick T. Harker are scheduled to speak in the afternoon, the pair will have a chance to recover. However, there could be another bullish factor, which is a fall in the Chicago PMI Index. If the pair continues its bearish trend, it is better to open long positions on the decline.
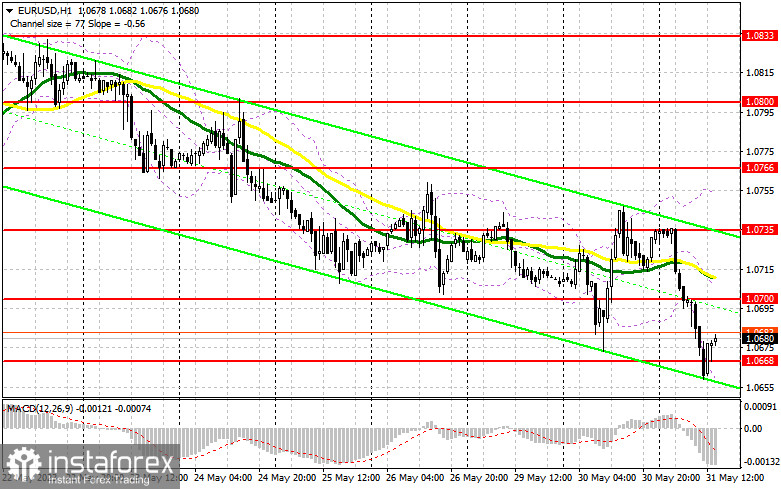
Only a false breakout of the support level of 1.0668, formed in the morning, will indicate the presence of large traders who are willing to push the euro up against the bearish trend. It will give new entry points into long positions with the aim of rising to the resistance level of 1.0700. Moving averages are passing just above this level. A breakout and a downward retest of 1.0700 in the afternoon will facilitate demand for the euro, generating an additional entry point into long positions. The pair will increase to 1.0735. A more distant target will be the 1.0766 level where I recommend locking in profits. If EUR/USD declines and bulls fail to protect 1.0668, which is more likely, especially after the hawkish statements of Fed policymakers, the bearish trend will continue. Therefore, only a false breakout of a new monthly low of 1.0634 will give a new entry point into long positions. You could buy EUR/USD at a bounce from 1.0595, keeping in mind an upward intraday correction of 30-35 pips.
When to open short positions on EUR/USD:
Bears are in control, taking advantage of the Fed's hawkish rhetoric. The regulator could raise rates in June despite all the hints not to do so. Protecting the new resistance of 1.0700 is now a priority and a suitable scenario for opening short positions in the continuation of the trend.

A false breakout of this level will give a sell signal that may push the pair to 1.0668. Consolidation below this level as well as an upward test will trigger a fall to a monthly low of 1.0634. A more distant target will be the 1.0595 level where I recommend locking in profits. If EUR/USD rises during the American session and bears show no energy at 1.0700, the pair may start the upward correction. In this case, it would be better to postpone short positions until a false breakout of 1.0735. You could sell EUR/USD at a bounce from 1.0766, keeping in mind a downward intraday correction of 30-35 pips.
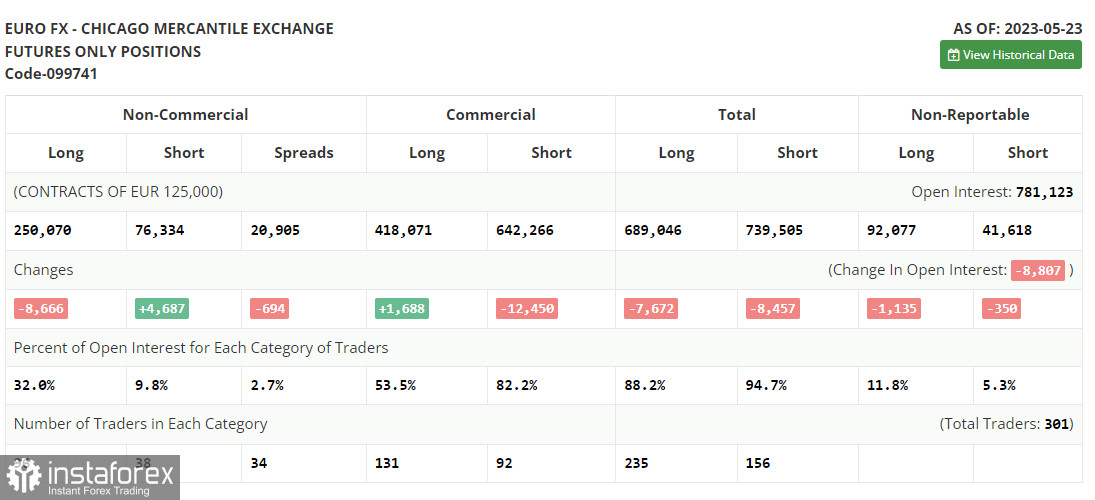
The COT report for May 23 logged a reduction in long positions and an increase in short positions. The decline in the euro continued as the debt situation had not yet been resolved, and the risks of a more severe recession in the US remained. However, even after the news of reaching an agreement and avoiding a US default, the US dollar continued to be in demand. The latest inflation data confirmed the need for further rate hikes by the Federal Reserve, so investors are no longer counting on a summer lull. The COT report indicates that non-commercial long positions decreased by 8,666 to 250,070, while non-commercial short positions jumped by 4,687 to 76,334. As a result, the total non-commercial net position increased to 185,045 from 187,089. The weekly closing price declined to 1.0793 from 1.0889.

Indicators' signals:
Trading is carried out below the 30 and 50 daily moving averages, which indicates a further downward movement.
Moving averages
Note: The period and prices of moving averages are considered by the author on the H1 (1-hour) chart and differ from the general definition of the classic daily moving averages on the daily D1 chart.
Bollinger Bands
If EUR/USD rises, the indicator's upper border at 1.0740 will serve as resistance.
Description of indicators
- Moving average (moving average, determines the current trend by smoothing out volatility and noise). Period 50. It is marked yellow on the chart.
- Moving average (moving average, determines the current trend by smoothing out volatility and noise). Period 30. It is marked green on the chart.
- MACD indicator (Moving Average Convergence/Divergence - convergence/divergence of moving averages) Quick EMA period 12. Slow EMA period to 26. SMA period 9
- Bollinger Bands (Bollinger Bands). Period 20
- Non-commercial speculative traders, such as individual traders, hedge funds, and large institutions that use the futures market for speculative purposes and meet certain requirements.
- Long non-commercial positions represent the total long open position of non-commercial traders.
- Short non-commercial positions represent the total short open position of non-commercial traders.
- Total non-commercial net position is the difference between the short and long positions of non-commercial traders.
 English
 Русский
 Bahasa Indonesia
 Bahasa Malay
 ไทย
ไทย Español
 Deutsch
 Български
 Français
 Tiếng Việt
 中文
中文 বাংলা
বাংলা हिन्दी
 Čeština
 Українська
 Română

