EUR/USD

Higher timeframes
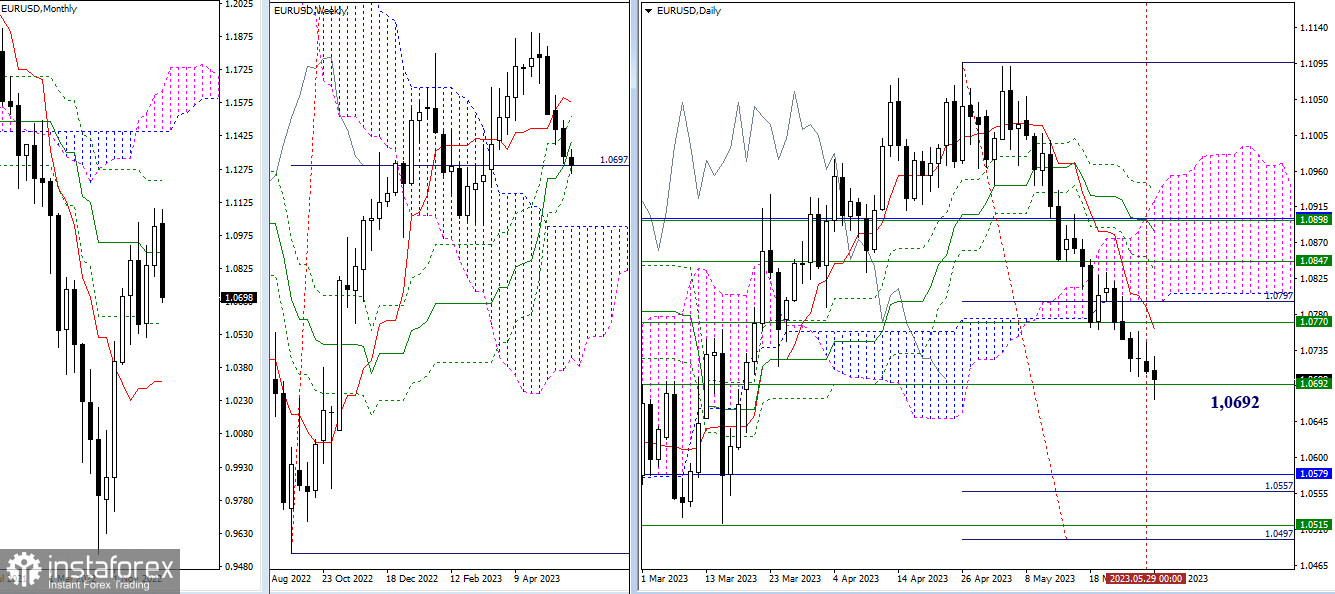
The pair has started testing the weekly support at 1.0692. A breakthrough and consolidation below the final level of the weekly golden cross of Ichimoku will allow the cross to be eliminated, opening up new prospects for a decline. The current bearish targets are the monthly support (1.0579), weekly support (1.0515), and the bearish target for breaking the daily cloud (1.0557-1.0497). In case of a rebound and recovery of bullish positions, the immediate resistance level will be the range of 1.0761–1.0770 (daily short-term trend + weekly medium-term trend).

H4 - H1
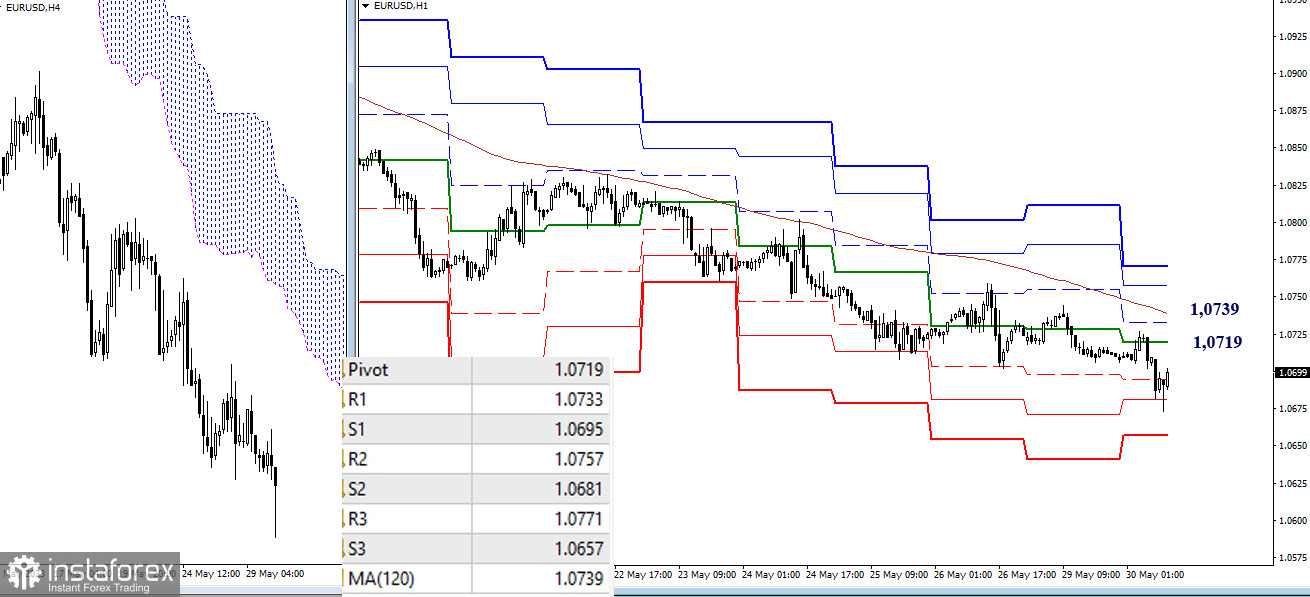
On lower timeframes, the pair continues to develop a downward trend, which has already encountered support at S2 (1.0681) today, with a possible further meeting with S3 (1.0657). Key levels on the lower timeframes today act as resistances, located at 1.0719 (central pivot point of the day) and 1.0739 (weekly long-term trend). A consolidation above these levels will change the balance of power and bring relevance to bullish targets—the resistances of classic pivot points R2 (1.0757) and R3 (1.0771).
***
GBP/USD

Higher timeframes
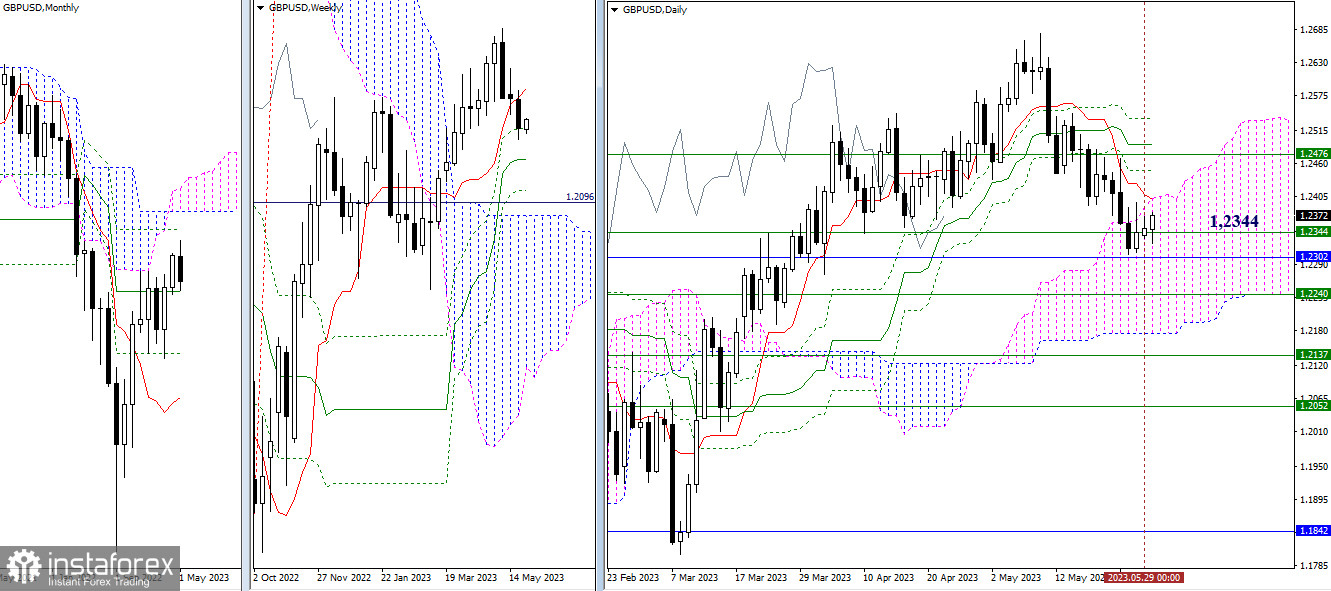
The mentioned slowdown, centered around the weekly level (1.2344), continues to develop, so the situation fundamentally has not undergone significant changes in the past trading day. A breakthrough of the monthly support at 1.2302 will pave the way to 1.2240 (weekly medium-term trend) and 1.2173 (lower boundary of the daily cloud). A rise above the resistance at 1.2399 (daily short-term trend + upper boundary of the daily cloud) will shift the focus to the levels of the daily Ichimoku cross (1.2449-1.2492-1.2536), reinforced by the weekly short-term trend (1.2476).

H4 - H1
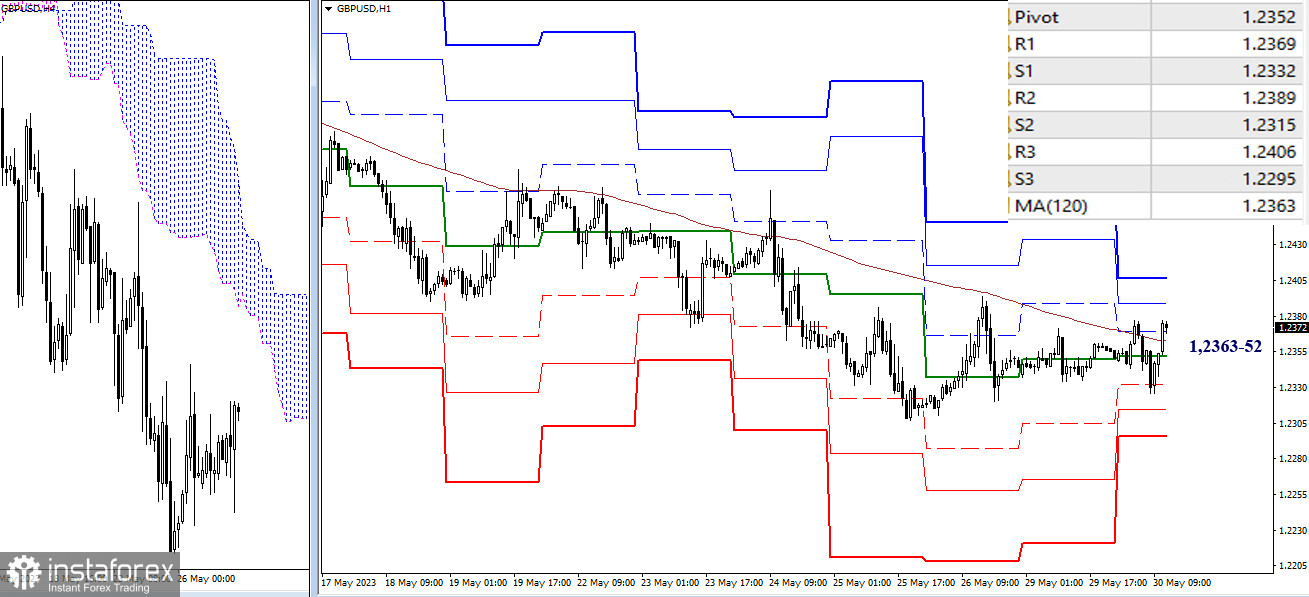
On lower timeframes, there is currently a struggle for key levels. They are combining their efforts within a relatively narrow range of 1.2363–52 (central pivot point + weekly long-term trend). Working above these levels will strengthen bullish sentiment, with the resistances of classic pivot points (1.2389-1.2406) serving as targets within the day. Working below the key levels will shift market focus to bearish prospects, with the supports of classic pivot points (1.2315-1.2295) serving as targets.
The technical analysis of the situation uses:
Higher timeframes - Ichimoku Kinko Hyo (9.26.52) + Fibo Kijun levels
Lower timeframes - H1 - Pivot Points (classic) + Moving Average 120 (weekly long-term trend)
 English
 Русский
 Bahasa Indonesia
 Bahasa Malay
 ไทย
ไทย Español
 Deutsch
 Български
 Français
 Tiếng Việt
 中文
中文 বাংলা
বাংলা हिन्दी
 Čeština
 Українська
 Română

