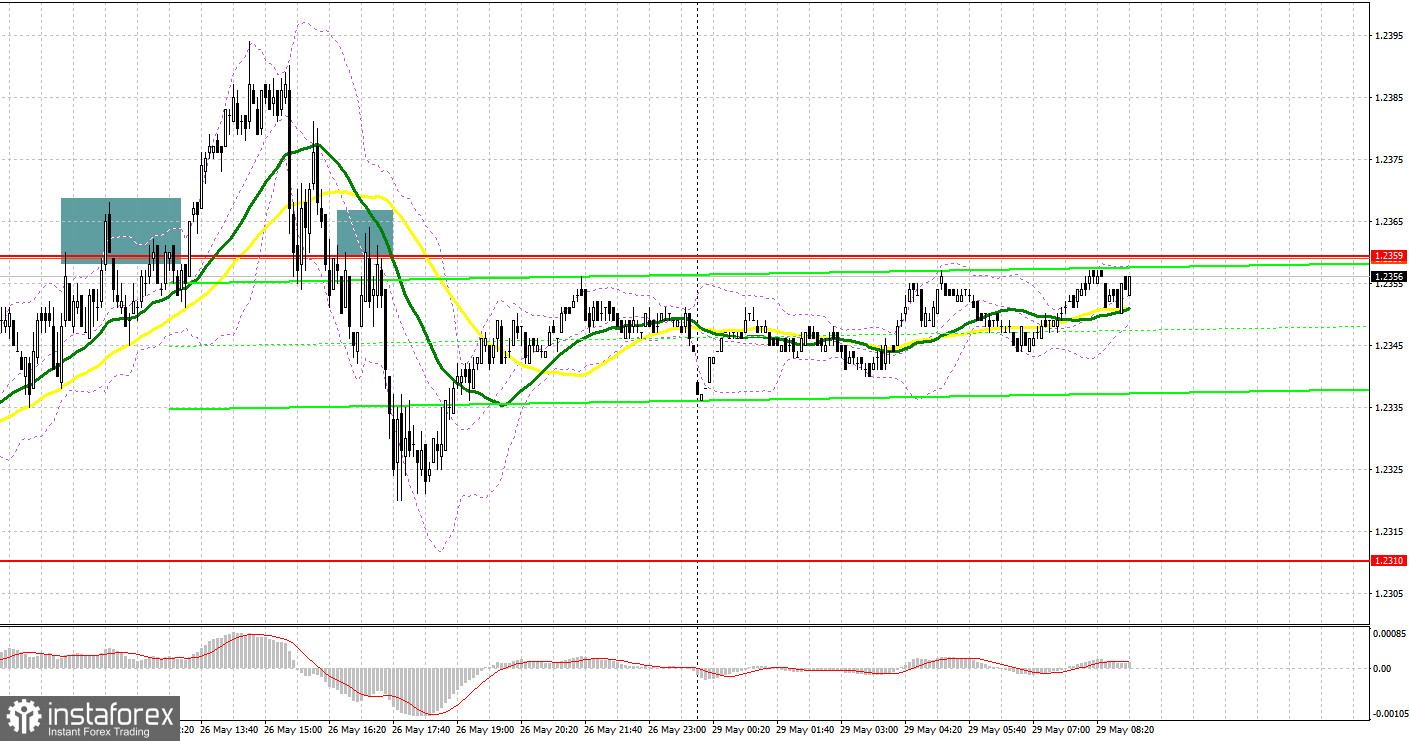
Several entry signals were formed in the market last Friday. Let us take a look at the 5-minute chart and figure out what happened. In my morning forecast, I drew attention to the level of 1.2359 and recommended making entry decisions with this level in mind. The upsurge and formation of a false breakout there created a sell signal, but a significant downward movement did not occur. An excellent entry point was only formed in the second half of the day after the pair dropped below 1.2359 and performed an upward retest. As a result, the pound fell by more than 30 pips.

When to open long positions on GBP/USD:
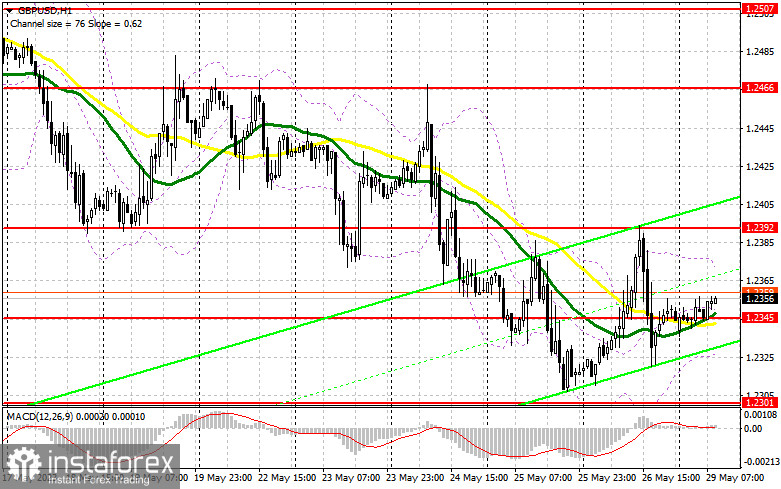
Today, there are no data releases in the UK. Traders will likely react to the good news regarding the agreement on raising the US debt limit. The pound sterling's growth will clearly continue amid low trading volumes, but I will act only if it declines, relying on the nearest levels. A buy signal targeting 1.2392 will only be created after GBP/USD hits and retests the intermediate support at 1.2345. The moving averages in that area favor the bulls. A false breakout of this level will allow the pair to rebound, and if its breaks through and consolidates above this range, it will form an additional buy signal, surging towards 1.2430. The most distant target will be the area around 1.2466, where I will take profit. If GBP/USD declines towards 1.2345 amid lack of activity from buyers, the bearish trend will continue. In that case, I will postpone opening new long positions until a false breakout of the new monthly low around 1.2301. I plan to buy GBP/USD immediately on a rebound from 1.2255, targeting an intraday correction of 30-35 pips.
When to open short positions on GBP/USD:
Bears showed themselves on Friday after the release of the latest US CPI data. The data release showed that inflation in the US has increased. Now, bearish traders are currently keeping the market under their control. However, considering the positive debt ceiling news, the pound correction may continue, so caution is needed when going short on the par. A failed consolidation above 1.2392, a new resistance level formed last Friday, will create a sell signal. The resulting downward movement may lead to a retest of the intermediate support level of 1.2345. A breakout and an upward retest of this range will intensify the pressure on GBP/USD, forming a sell signal and sending the pair down towards 1.2301. The low at 1.2225 remains the most distant target, where I will take profit. If GBP/USD increases and bears are idle at 1.2392, it is best to postpone opening short positions until the pair tests the stronger resistance level at 1.2430, where the moving averages are located. A false breakout of this level will provide an entry point for short positions. If there is no downward movement there, I will sell GBP/USD immediately if it rebounds from the high of 1.2466, targeting an intraday correction of 30-35 pips.

Commitment of Traders (COT) report:
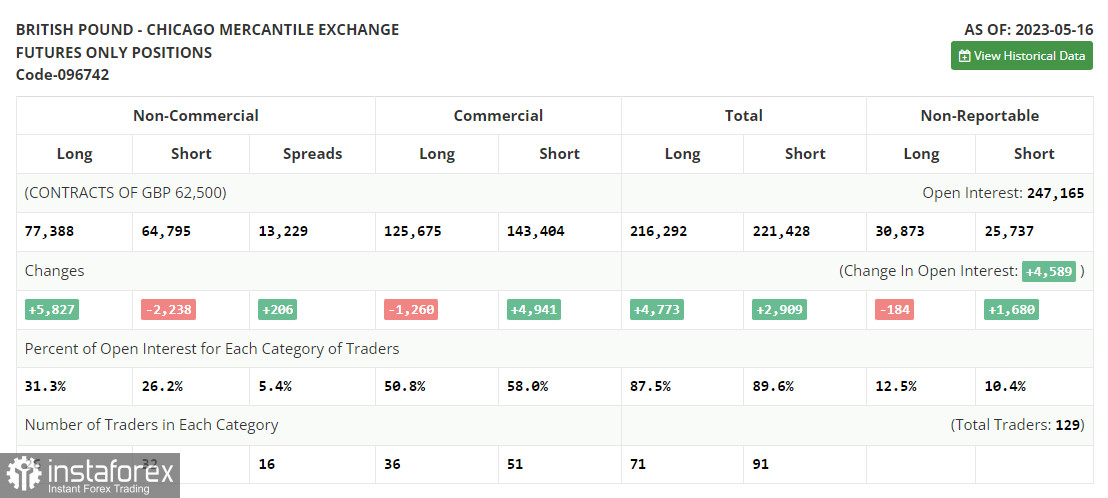
The Commitment of Traders (COT) report for May 16 showed that long positions increased while short positions decreased. A significant correction in the British pound has occurred, and the pair is traded at very attractive prices, which is reflected in the report. Once the issue of the US debt limit is resolved, I believe that the demand for risk assets will return, and the pound sterling will be able to recover quite significantly. It should be noted that the Fed is planning to pause its rate hike cycle, which will also put pressure on the US dollar. The latest COT report states that non-commercial short positions decreased by 2,238 to 64,795, while non-commercial long positions increased by 5,827 to 77,388. As a result, the non-commercial net position increased to 12,593 against 4,528 the previous week. The weekly price decreased to 1.2495 from 1.2635.

Indicator signals:
Moving averages
Trading is taking place around the 30-day and 50-day moving averages, showing the bulls' attempt to continue the correction.
Note: The period and prices of the moving averages considered by the author are on the hourly chart (H1) and differ from the general definition of classical daily moving averages on the daily chart (D1).
Bollinger Bands
If the pair declines, support will be provided by the lower band of the indicator around 1.2320.
Description of indicators
Moving average (moving average, determines the current trend by smoothing out volatility and noise). Period 50. It is marked yellow on the chart. Moving average (moving average, determines the current trend by smoothing out volatility and noise). Period 30. It is marked green on the chart. MACD indicator (Moving Average Convergence/Divergence - convergence/divergence of moving averages) Quick EMA period 12. Slow EMA period to 26. SMA period 9 Bollinger Bands (Bollinger Bands). Period 20 Non-commercial speculative traders, such as individual traders, hedge funds, and large institutions that use the futures market for speculative purposes and meet certain requirements. Long non-commercial positions represent the total long open position of non-commercial traders. Short non-commercial positions represent the total short open position of non-commercial traders. Total non-commercial net position is the difference between the short and long positions of non-commercial traders. English
 Русский
 Bahasa Indonesia
 Bahasa Malay
 ไทย
ไทย Español
 Deutsch
 Български
 Français
 Tiếng Việt
 中文
中文 বাংলা
বাংলা हिन्दी
 Čeština
 Українська
 Română

