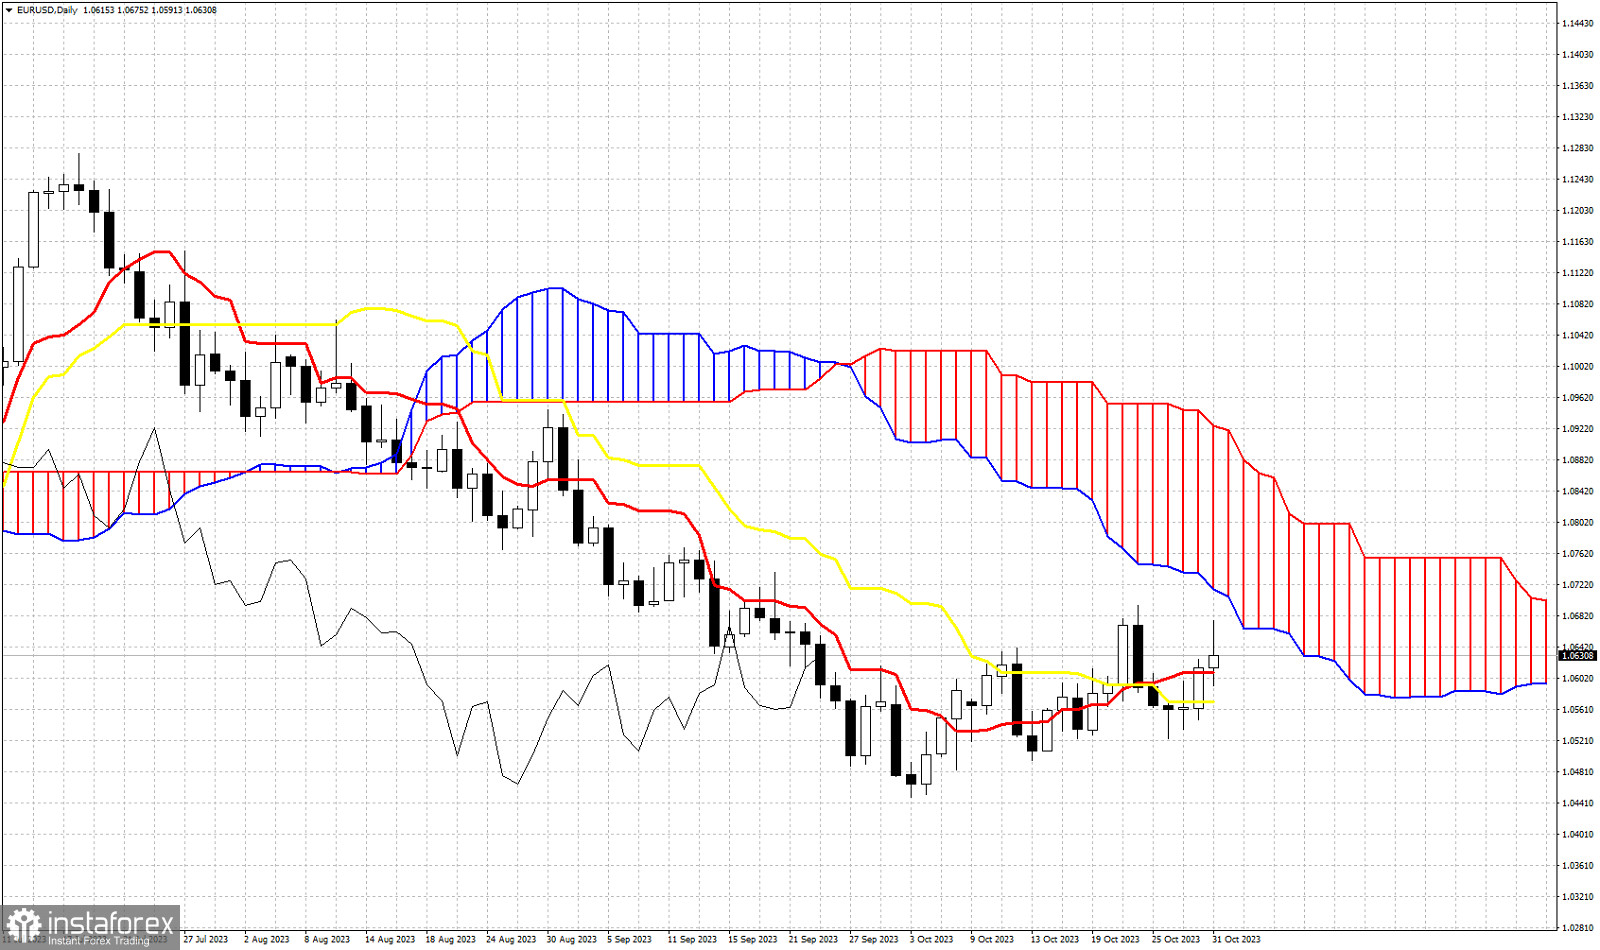
EURUSD is trading around 1.0630 after making earlier a high at 1.0675. According to the Ichimoku cloud indicator in the daily chart, trend remains bearish a price is still below the Daily Kumo (cloud) resistance. The Chikou span (black line indicator) is still below the candlestick pattern (bearish). The tenkan-sen (red line indicator) provides support at 1.0609, while the kijun-sen (yellow line indicator) provides support at 1.0571. EURUSD is above these two indicators suggesting there are increased chances of a bounce higher. Thus far the lower cloud boundary has not been really tested. Price has not even touched it yet. So as long as EURUSD is above 1.0570, we could see a test of the cloud's lower boundary. Failure to hold above 1.0570 will be a sign of weakness and could lead EURUSD to new lows.
 English
 Русский
 Bahasa Indonesia
 Bahasa Malay
 ไทย
ไทย Español
 Deutsch
 Български
 Français
 Tiếng Việt
 中文
中文 বাংলা
বাংলা हिन्दी
 Čeština
 Українська
 Română

