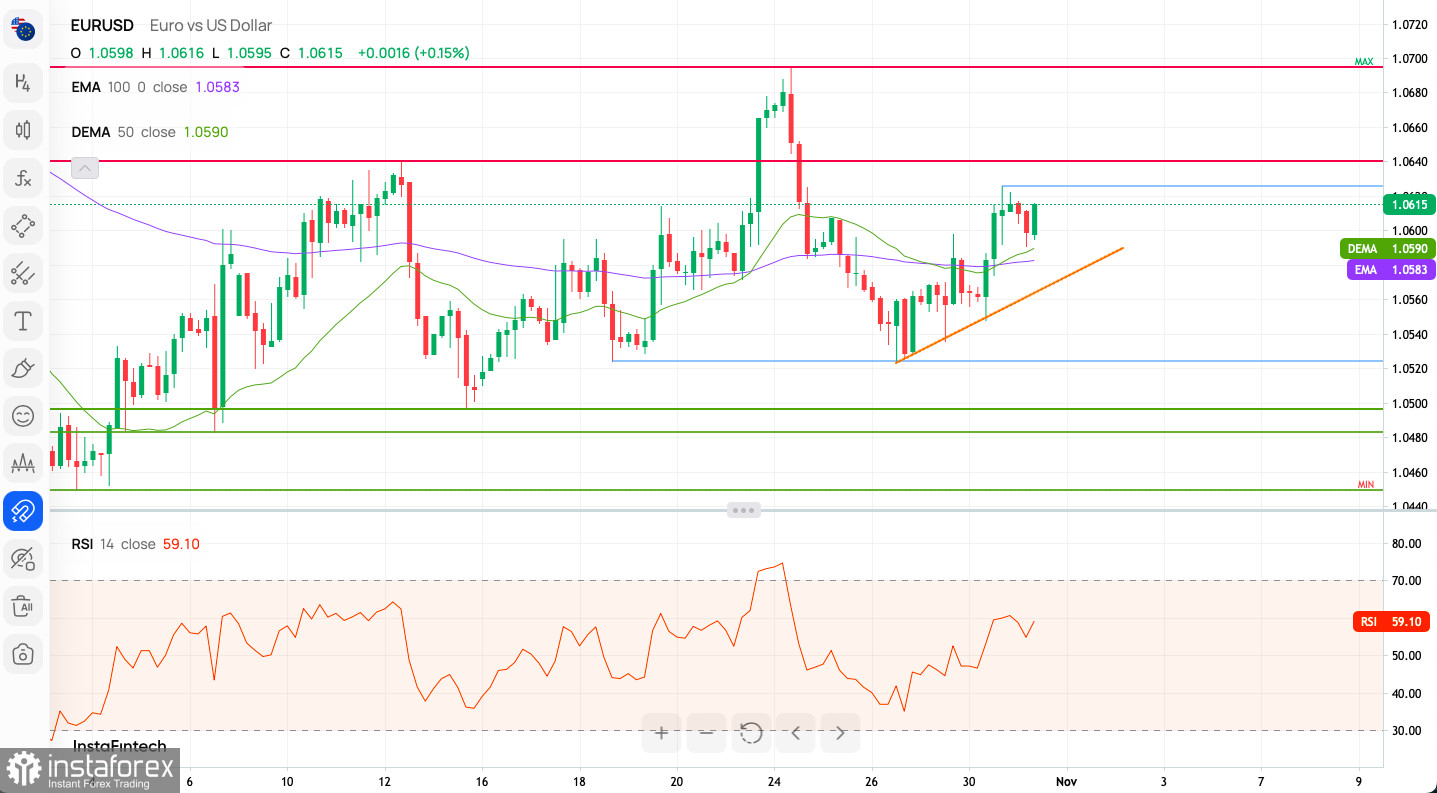
Technical Market Outlook:
The EUR/USD pair had bounced from the 50 and 100 MA on the H4 time frame chart seen at the level of 1.0578 and is heading higher. The nearest technical resistance is located at the level of 1.0622 and the intraday technical support is seen at the level of 1.0578. The next target for bears is the technical support located at the level of 1.0524 and 1.0496, but in order to do this, bears need to break below the intraday support. If the latter is violated, then the key short-term technical support located at the level of 1.0449 would be exposed for the test. Please keep an eye on the monthly candle close today.

Weekly Pivot Points:
WR3 - 1.05822
WR2 - 1.05716
WR1 - 1.05672
Weekly Pivot - 1.05610
WS1 - 1.05566
WS2 - 1.05504
WS3 - 1.05398
Trading Outlook:
Since the beginning of October 2022 the EUR/USD is in the corrective cycle to the upside, but the main, long-term trend remains bearish. This corrective cycle was terminated at the level of 1.1286 which is 61% Fibonacci retracement level and the market reversed lower. The intermediate down move is 16 weeks long now and there is no indication if the down move termination yet. There is still a room to the downside on the RSI indication on the weekly time frame as well.
 English
 Русский
 Bahasa Indonesia
 Bahasa Malay
 ไทย
ไทย Español
 Deutsch
 Български
 Français
 Tiếng Việt
 中文
中文 বাংলা
বাংলা हिन्दी
 Čeština
 Українська
 Română

