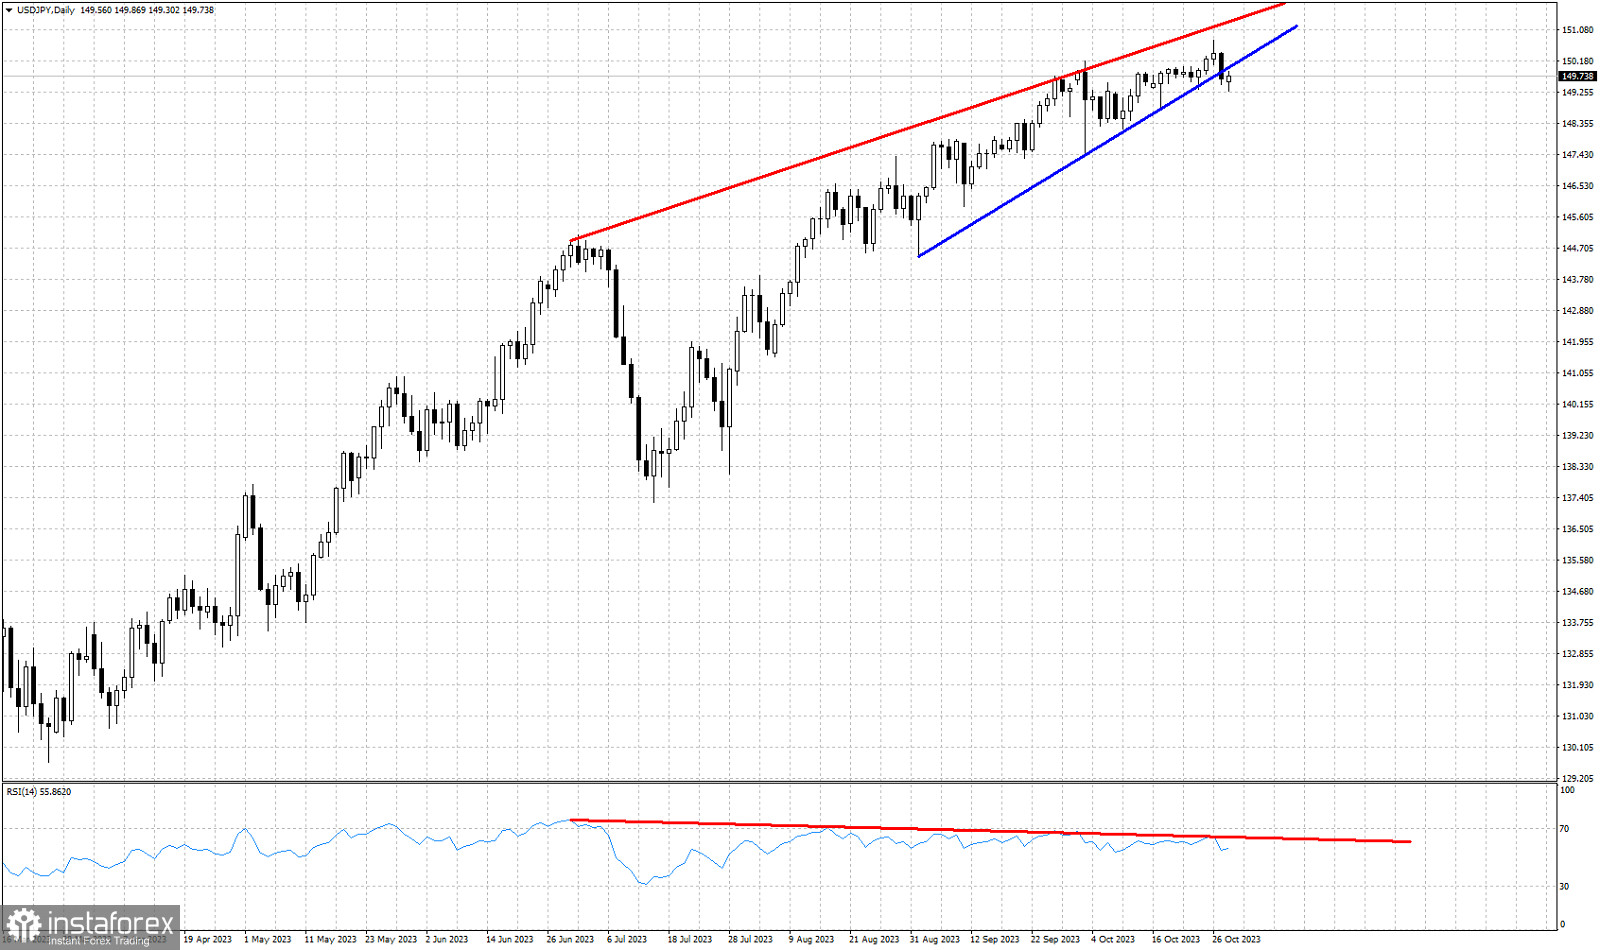
Red lines- bearish divergence
Blue line- support trend line
USDJPY is trading around 149.78 after making a new higher high at 150.79. Despite making a new higher high in price, the RSI did not follow but instead provided a new bearish divergence. The upside potential in USDJPY is limited. The USDJPY has broken below the blue support trend line. This is the first sign of weakness after a long time. This can be the start of a major pull back and bulls should be very cautious. Price continues making higher highs and higher lows. This sequence has not been cancelled yet. Breaking below the blue upward sloping support trend line is the first sign of a possible reversal. Bears have a lot of work to do in order to confirm the reversal. The recent low at 147.39 is a key low that if broken will confirm that the reversal is under way. Staying below the blue support trend line would also be another sing of weakness.
 English
 Русский
 Bahasa Indonesia
 Bahasa Malay
 ไทย
ไทย Español
 Deutsch
 Български
 Français
 Tiếng Việt
 中文
中文 বাংলা
বাংলা हिन्दी
 Čeština
 Українська
 Română

