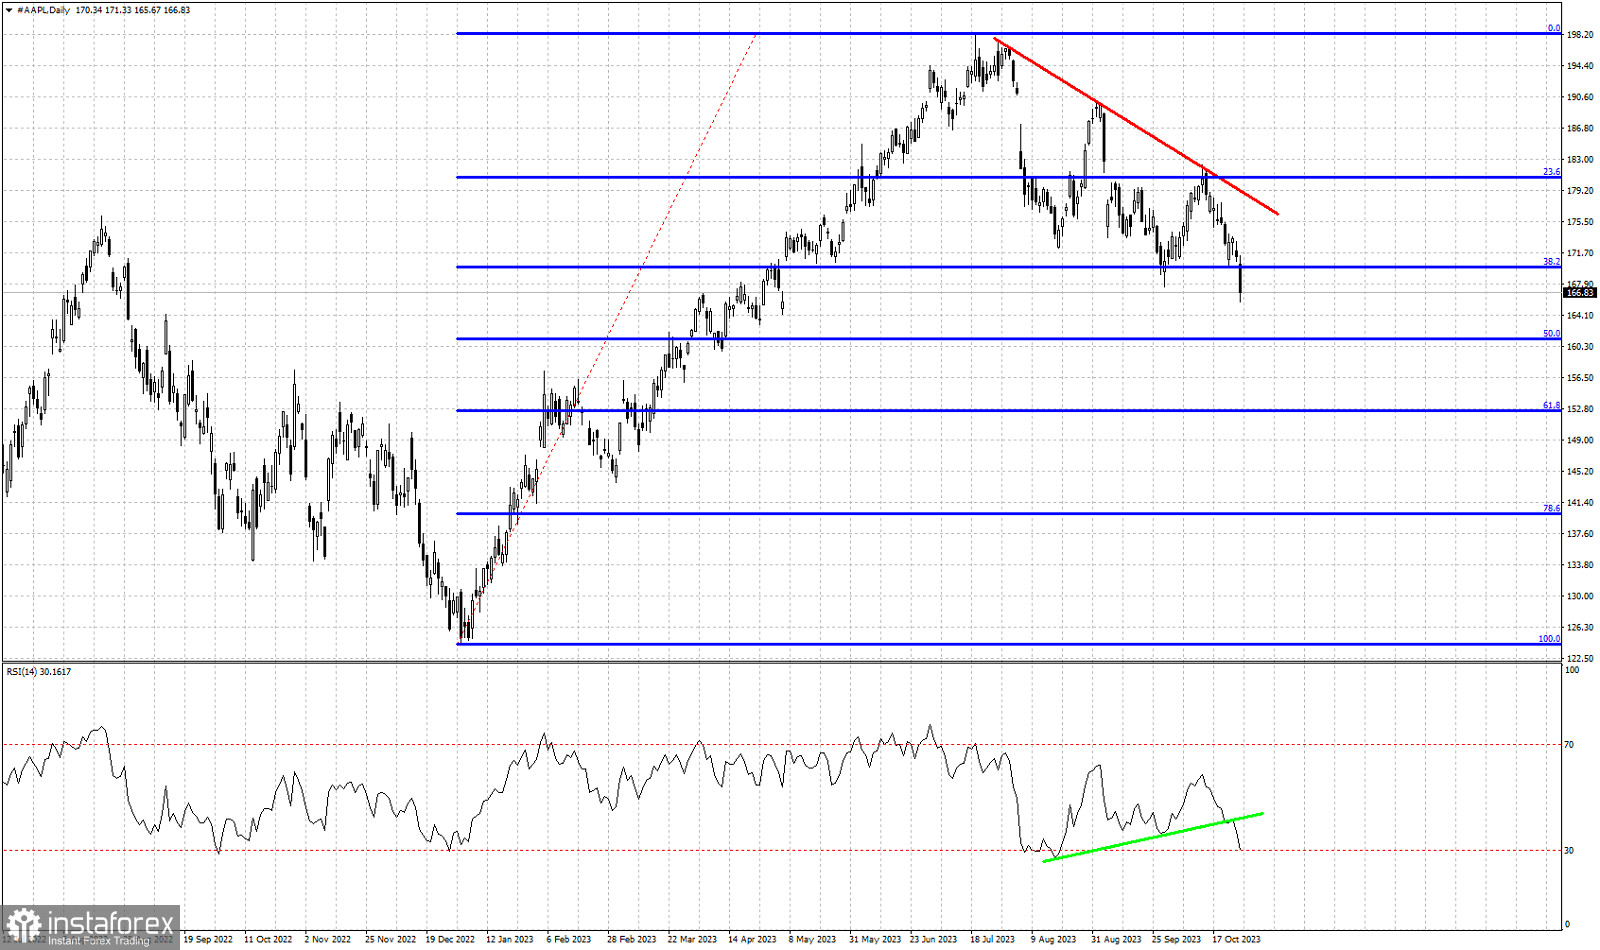
Red line- bearish trend line
Blue lines- Fibonacci retracement levels
Green line- RSI support trend line
In recent analysis on the AAPL stock we warned traders that as long as price is below the red downward sloping resistance trend line, AAPL stock price will be vulnerable to a move to lower lows. Recently price got rejected for a second time at the red trend line resistance. Price pulled back towards $170 near where the previous low was made. The RSI also paused its decline at the green support trend line. In the end bears were stronger and selling pressures pushed price to new lows and the RSI below the green trend line but not at new lows. At this current downward wave it is very important to see if the RSI makes a lower low or if it provides bullish divergence. The next key Fibonacci support level is at the 50% retracement around $161.
 English
 Русский
 Bahasa Indonesia
 Bahasa Malay
 ไทย
ไทย Español
 Deutsch
 Български
 Français
 Tiếng Việt
 中文
中文 বাংলা
বাংলা हिन्दी
 Čeština
 Українська
 Română

