EUR/USD

Higher timeframes
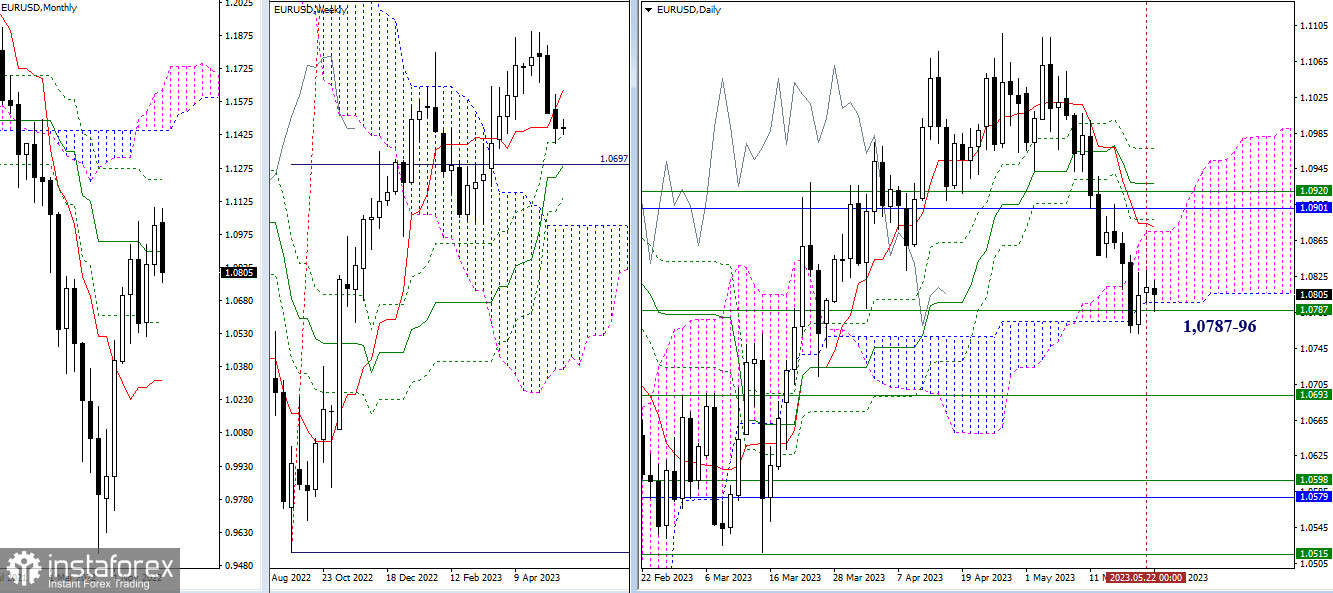
Over the past day, there have been no significant changes in the situation. The pair continues to hold a pause, using support levels at 1.0796 - 1.0787 (lower boundary of the daily cloud + weekly Fibo Kijun). A breakout could transfer initiative to the bears, with their immediate interest being the level of 1.0693 (weekly medium-term trend). A rebound and further position recovery will shift players' attention to resistance levels around 1.0875 - 1.0880 (upper boundary of the daily cloud + daily short-term trend) and 1.0901 - 1.0920 (monthly medium-term trend + weekly short-term trend).

H4 - H1
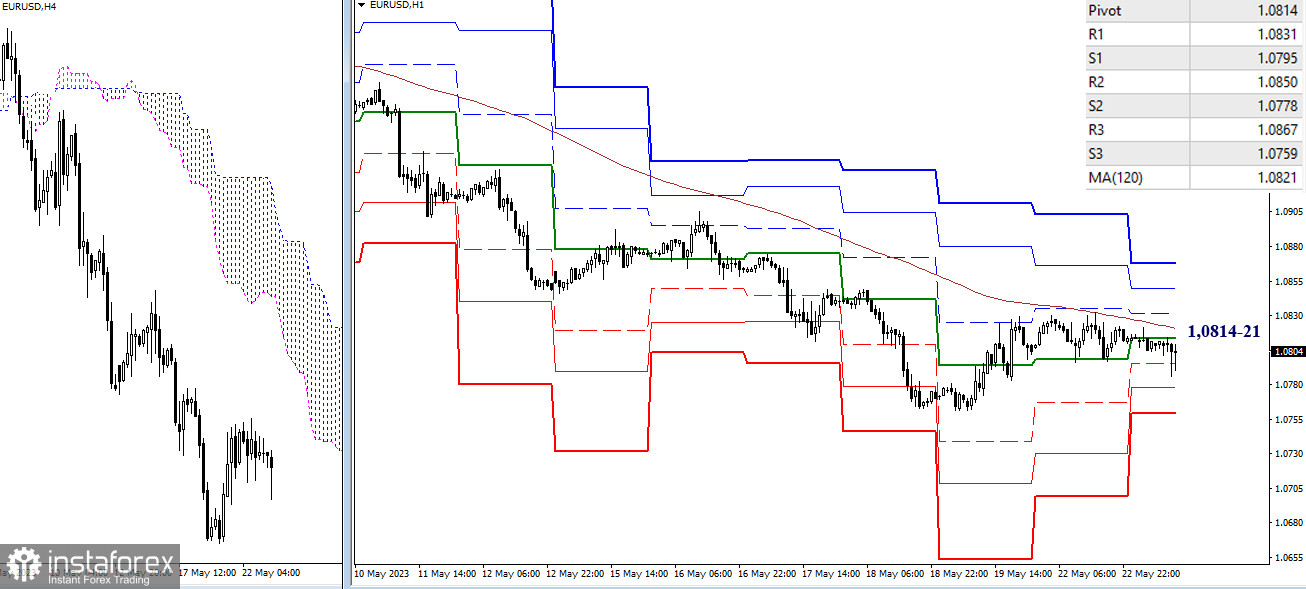
The pause on higher timeframes has maintained uncertainty on lower timeframes. Currently, the pair continues to operate near key levels, which are converging around 1.0814–21 (central pivot point + weekly long-term trend), with the main advantage still leaning towards bears. If there is progress in the price movement, the classic pivot points at 1.0795 - 1.0778 - 1.0759 (supports) and 1.0831 - 1.0850 - 1.0867 (resistances) may have significance within the day.
***
GBP/USD

Higher timeframes
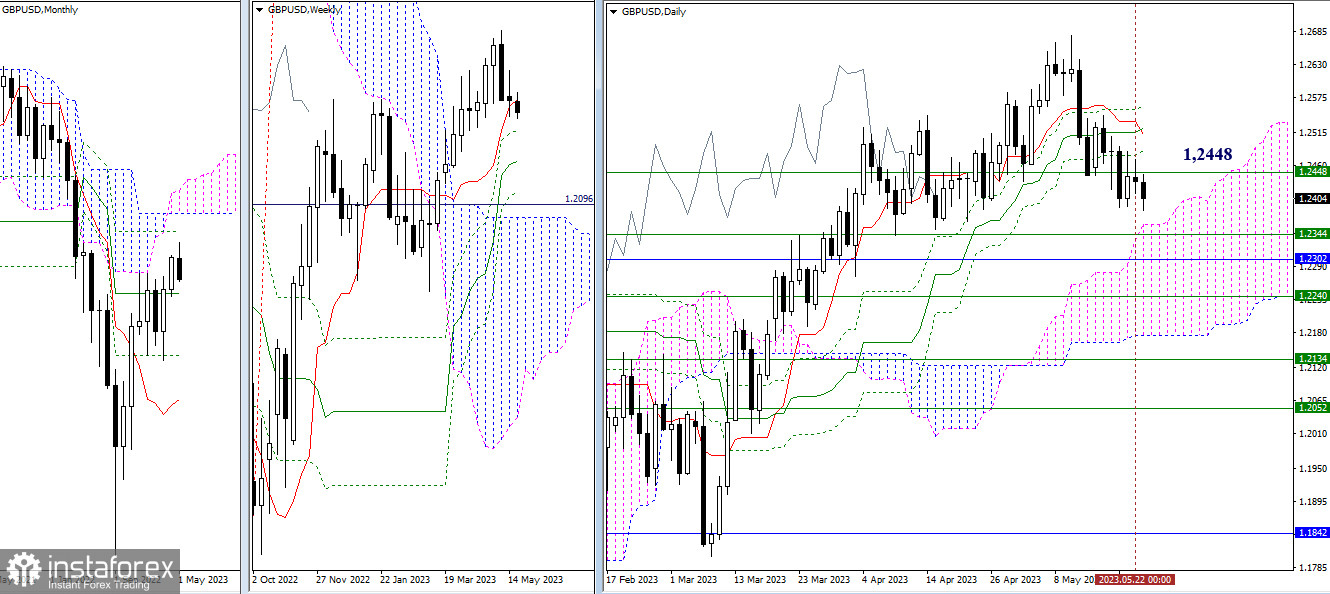
Not much has changed after yesterday's trade. The weekly short-term trend (1.2448) continues to exert influence, hindering the development of the situation. The nearest support zone is currently around 1.2361 - 1.2344 - 1.2302 (upper boundary of the daily cloud + weekly Fibo Kijun + monthly medium-term trend), while the nearest resistance zone is currently formed by the levels of the daily Ichimoku cross (1.2477 - 1.2515 - 1.2534 - 1.2553).

H4 - H1
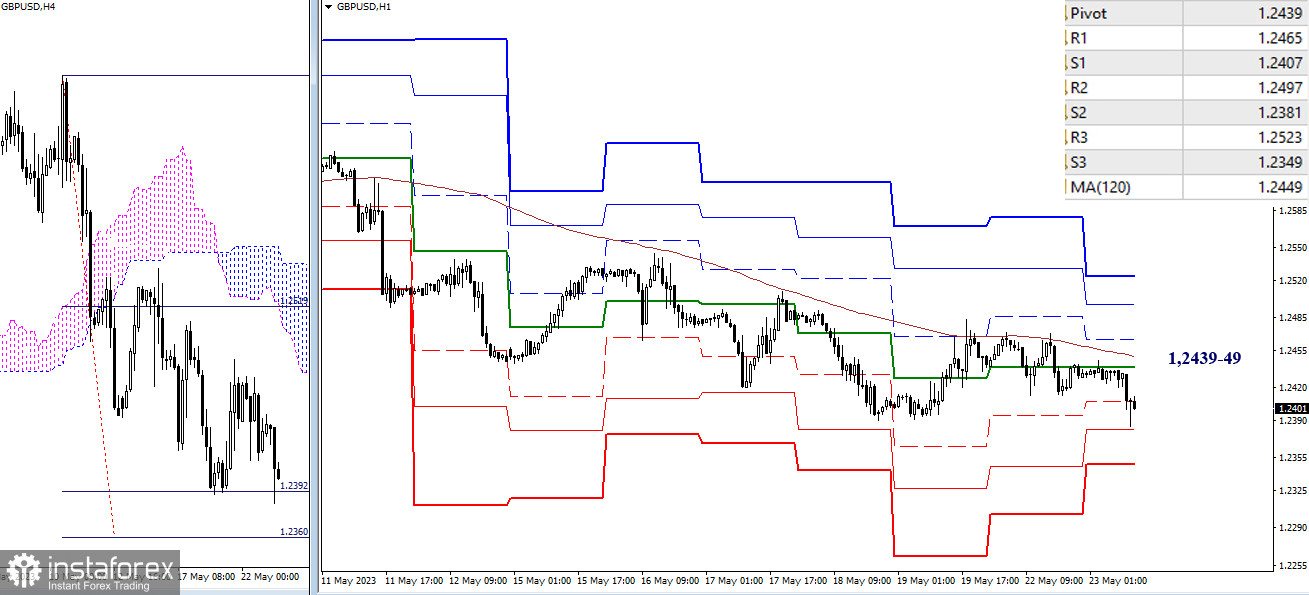
On the lower timeframes, the price continues to work below key levels. They have now almost merged around 1.2439–49 (weekly long-term trend + central pivot point of the day). Working below these key levels maintains the advantage for bears. The support levels of classic pivot points (1.2381 - 1.2349) serve as targets for further decline. A consolidation above the key levels may change the current balance of power. In that case, intraday attention will shift to the resistance levels of classic pivot points (1.2465 - 1.2497 - 1.2523).
The technical analysis of the situation uses:
Higher timeframes - Ichimoku Kinko Hyo (9.26.52) + Fibo Kijun levels
Lower timeframes - H1 - Pivot Points (classic) + Moving Average 120 (weekly long-term trend)
 English
 Русский
 Bahasa Indonesia
 Bahasa Malay
 ไทย
ไทย Español
 Deutsch
 Български
 Français
 Tiếng Việt
 中文
中文 বাংলা
বাংলা हिन्दी
 Čeština
 Українська
 Română

