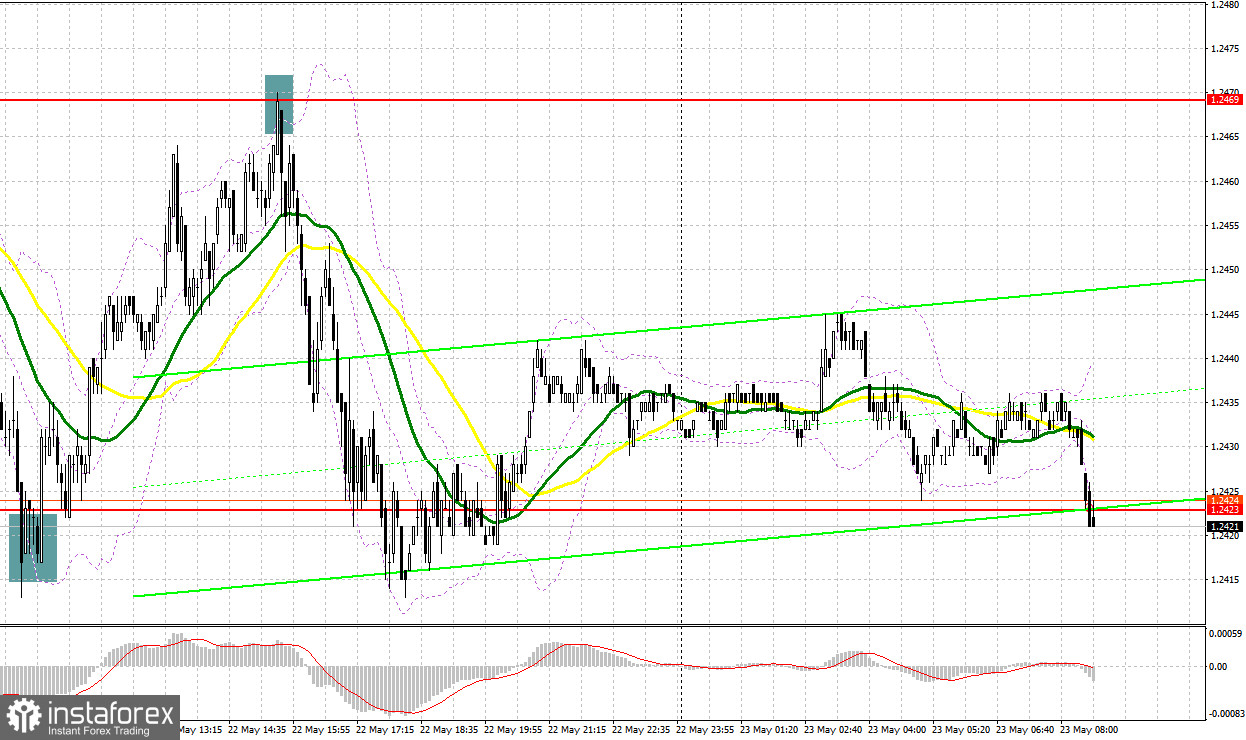
Yesterday, the pair formed several entry signals. Let's have a look at the 5-minute chart and see what happened there. In my morning review, I mentioned the level of 1.2423 as a possible entry point. A decline to this level and its false breakout generated a nice buy signal in line with the ongoing correction. As a result, the price went up by more than 40 pips. In the second half of the day, bears showed their presence at 1.2469, thus forming a sell signal and sending the pound back to 1.2420.

For long positions on GBP/USD:
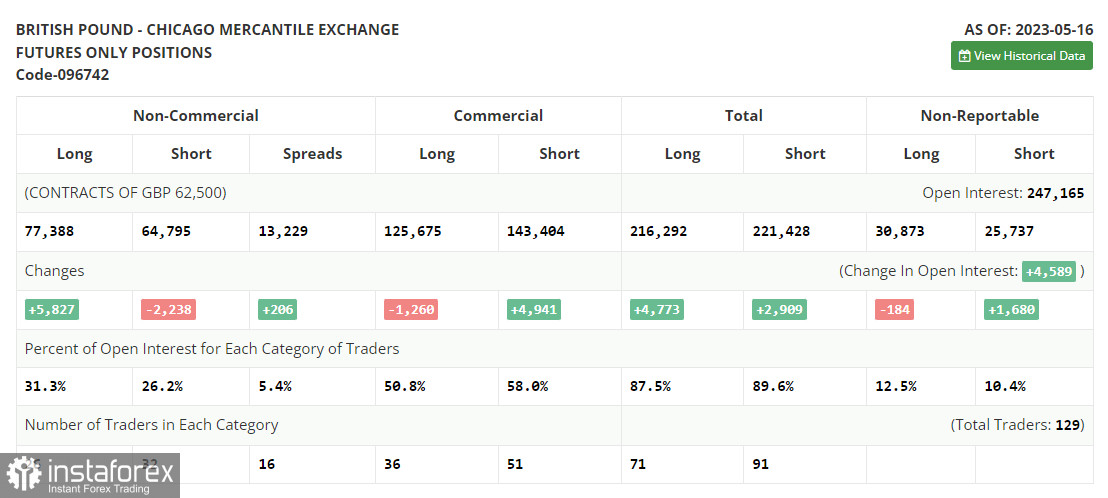
Before analyzing the technical outlook for the British pound, let's take a look at what happened in the futures market. According to the Commitments of Traders (COT) report as of May 16, there was an increase in long positions and a decrease in short positions. The correction in the British pound was quite significant, and the pair is trading at very attractive prices, which is reflected in the report. Once the issue of the US debt ceiling is resolved, I believe that the demand for risk assets will return, and the pound will be able to recover quite substantially. It is worth noting that the Federal Reserve plans to pause its cycle of interest rate hikes, which will also put pressure on the US dollar. The latest COT report states that short positions of the non-commercial group of traders decreased by 2,238 to 64,795, while long positions jumped by 5,827 to f 77,388. This led to an increase in the non-commercial net position to 12,593 compared to 4,528 the previous week. The weekly closing price declined to 1.2495 from 1.2635.
In addition to the data on business activity in the UK, today there will also be parliamentary hearings of the Bank of England on monetary policy, as well as a speech by the Governor of the Bank of England, Andrew Bailey. It is evident that the regulator will declare its further readiness to raise rates in order to combat inflation, which is exceeding 10.0%. For this reason, assuming a strong UK Manufacturing Purchasing Managers' Index (PMI) and Services PMI, the pound may strengthen against the dollar and continue its upward correction.

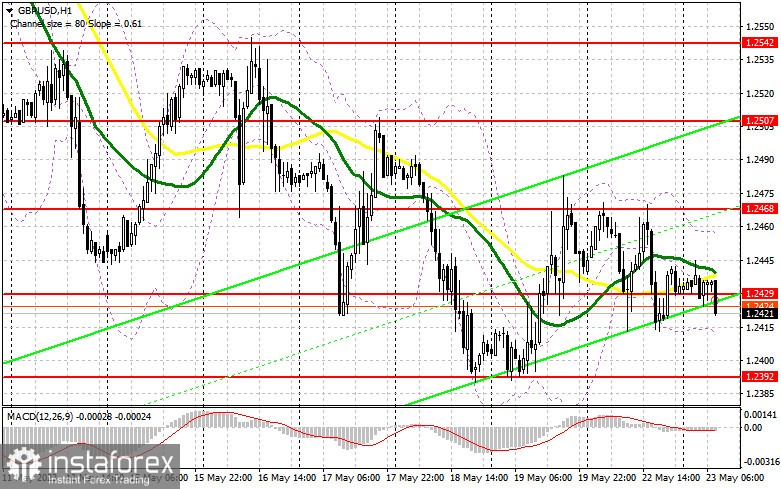
Considering that I expect a fairly significant surge in volatility, I will not rush with purchases. To build up long positions, I will focus on protecting the support level of 1.2392, the low of this month, where a false breakout formation will provide an excellent entry point with a possible recovery of the pair. This will allow the price to reach 1.2429 where the moving averages favor the sellers. A breakout and a top-down test of this range will form an additional buy signal, which will bring back the correction and lead to a retest of 1.2468. Without this level, buyers of GBP/USD will find it difficult to rely on further growth. In case of a breakout above this range, we can talk about a surge towards 1.2507 where I will take profits. If GBP/USD declines and there are no buyers at 1.2392, the pressure on the pound will only increase. If that happens, I recommend postponing long positions until the price hits 1.2353. Buying will only be considered on a false breakout there. Opening long positions on GBP/USD immediately on a rebound can be done from 1.2310, keeping in mind an intraday correction of 30-35 pips.
For short positions on GBP/USD:
Bears are currently in control of the market and they showed their strength yesterday at 1.2468. However, today's fundamental data could once again lead to an increase in the pound, so sellers will clearly need strength. In case of another recovery of the pair, only a false breakout around 1.2468 will provide a sell signal, expecting further decline towards the nearest support at 1.2429 where I anticipate active resistance. A breakout and a subsequent bottom-up test of this range will provide a sell entry point with a renewed low at 1.2392, allowing sellers to regain the bearish trend. The area of 1.2353 will be a more distant target where I will take profits.
If GBP/USD rises and bears are idle at 1.2468, the market will continue its correction, and the situation may come under the control of buyers. In such a case, only a false breakout around the next resistance at 1.2507 will provide an entry point into short positions, considering a downward movement in the pound. If there is no activity there as well, I would advise selling GBP/USD from 1.2542, expecting a rebound of 30-35 pips within the day.

Indicator signals:
Moving Averages
Trading near the 30- and 50-day moving averages indicates a sideways movement.
Please note that the time period and levels of the moving averages are analyzed only for the H1 chart, which differs from the general definition of the classic daily moving averages on the D1 chart.
Bollinger Bands
In case of a rise, the upper band of the indicator at 1.2460 will serve as resistance. If the pair declines, the lower band of the indicator at 1.2410 will act as support.
Description of indicators:
• A moving average of a 50-day period determines the current trend by smoothing volatility and noise; marked in yellow on the chart;
• A moving average of a 30-day period determines the current trend by smoothing volatility and noise; marked in green on the chart;
• MACD Indicator (Moving Average Convergence/Divergence) Fast EMA with a 12-day period; Slow EMA with a 26-day period. SMA with a 9-day period;
• Bollinger Bands: 20-day period;
• Non-commercial traders are speculators such as individual traders, hedge funds, and large institutions who use the futures market for speculative purposes and meet certain requirements;
• Long non-commercial positions represent the total number of long positions opened by non-commercial traders;
• Short non-commercial positions represent the total number of short positions opened by non-commercial traders;
• The non-commercial net position is the difference between short and long positions of non-commercial traders.
 English
 Русский
 Bahasa Indonesia
 Bahasa Malay
 ไทย
ไทย Español
 Deutsch
 Български
 Français
 Tiếng Việt
 中文
中文 বাংলা
বাংলা हिन्दी
 Čeština
 Українська
 Română

