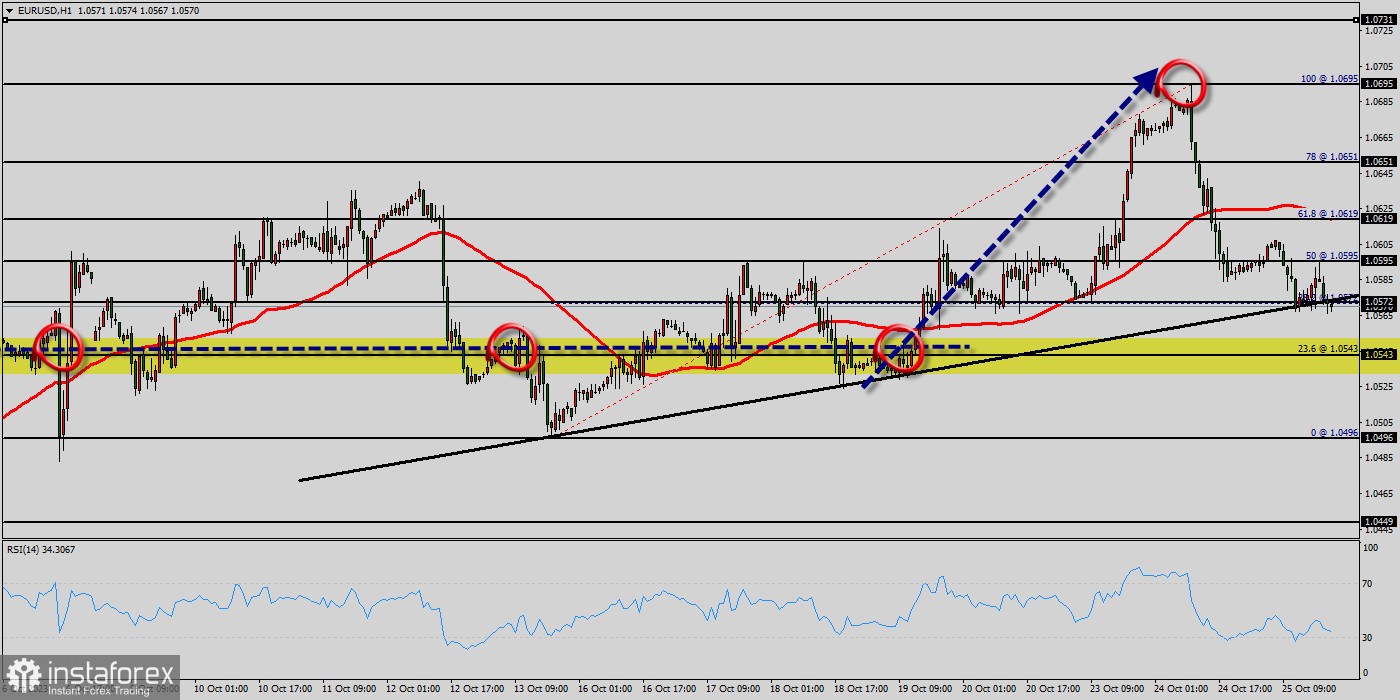
Today, the EUR/USD pair broken resistance at the level of 1.0507 which acts as support now. Thus, the pair has already formed minor support at 1.0507. The strong support is seen at the level of 1.0496 because it represents the weekly support 1. Equally important, the RSI and the moving average (100) are still calling for an uptrend.
Therefore, the market indicates a bullish opportunity at the level of 1.0507 in the H1 chart. Also, if the trend is buoyant, then the currency pair strength will be defined as following: GBP is in an uptrend and USD is in a downtrend.
Buy above the minor support of 1.0507 with the first target at 1.0619 (this price is coinciding with the ratio of 61.8% Fibonacci), and continue towards 1.0619 (the weekly resistance 1).
The level of 1.0619 coincides with a golden ratio (61.8% of Fibonacci), which is expected to act as major support today. The Relative Strength Index (RSI) is considered overbought because it is above 35. The RSI is still signaling that the trend is upward as it is still strong above the moving average (100). This suggests the pair will probably go up in coming hours. Accordingly, the market is likely to show signs of a bullish trend
On the other hand, if the price closes below the minor support, the best location for the stop loss order is seen below 1.0543; hence, the price will fall into the bearish market in order to go further towards the strong support at 1.0496 to test it again. Furthermore, the level of 1.0496 will form a double bottom.
 English
 Русский
 Bahasa Indonesia
 Bahasa Malay
 ไทย
ไทย Español
 Deutsch
 Български
 Français
 Tiếng Việt
 中文
中文 বাংলা
বাংলা हिन्दी
 Čeština
 Українська
 Română

