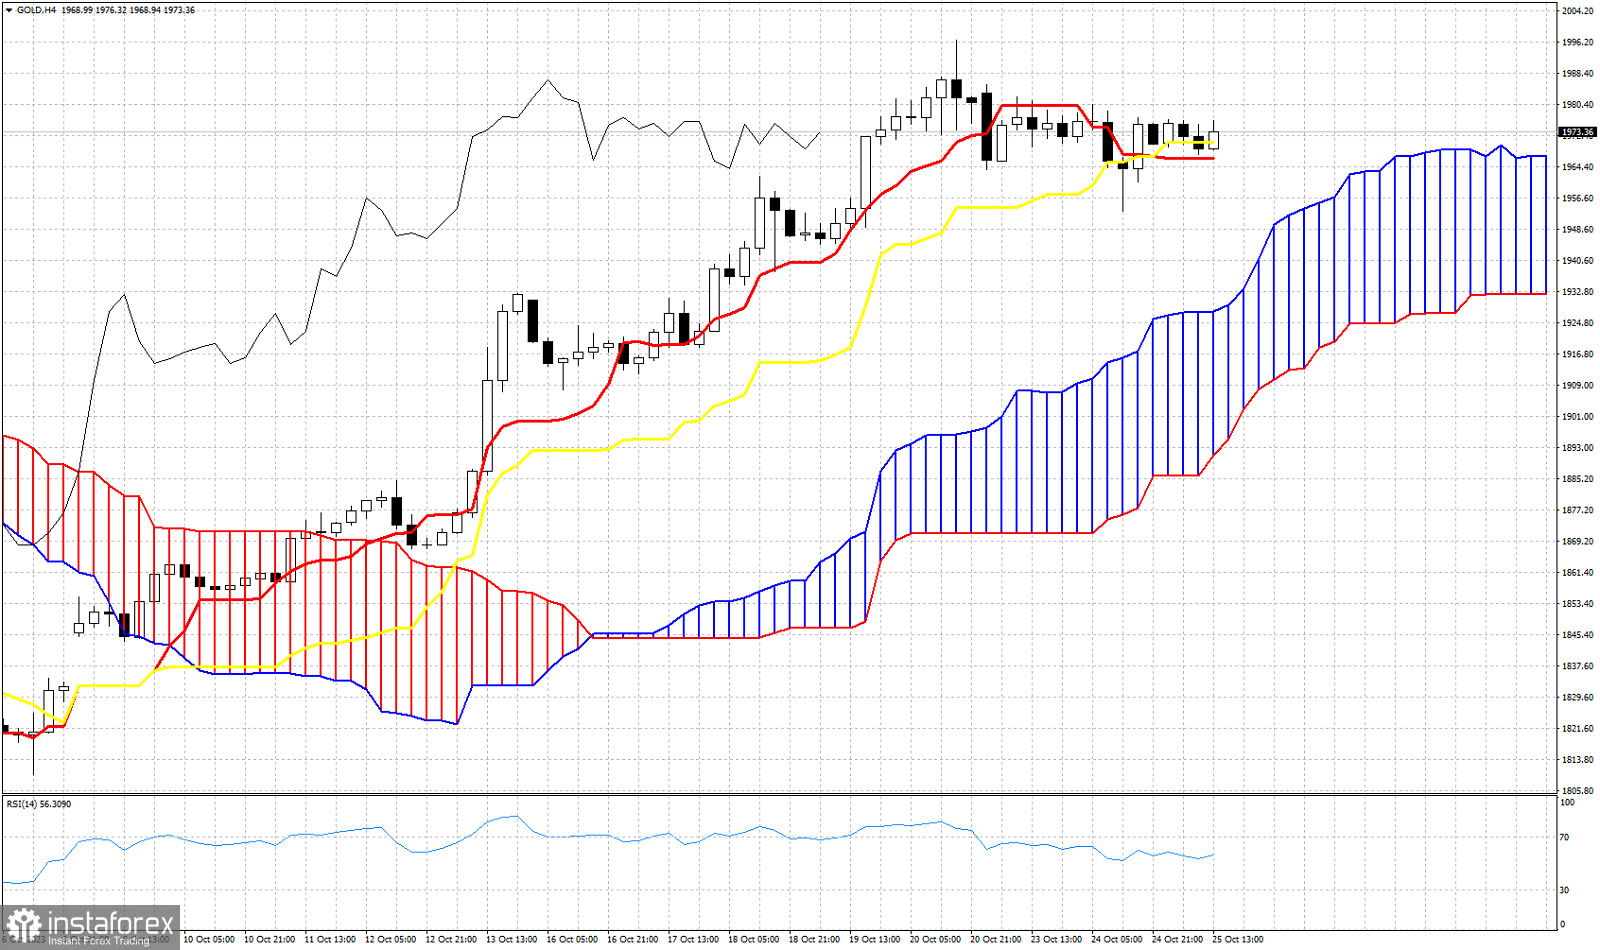
Gold price is trading around $1,975. Today we use the Ichimoku cloud indicator in the 4 hour chart to identify key support and trend change levels. According to the Ichimoku cloud indicator, despite the recent pull back and stop in advance, trend remains bullish as price is still above the Kumo (cloud). The Chikou span (black line indicator) remains above the candlestick pattern (bullish). The tenkan-sen (red line indicator) and the kijun-sen (yellow line indicator) provide support at $1,966 an d$1,970 respectively. Price remains above both suggesting that there is no sign of weakness. A break below $1,966 will be a sign of weakness that could lead price to a pull back towards the cloud support at $1,933. Gold price is mostly moving sideways the last couple of sessions. This consolidation is common after strong moves. Traders need to be patient now. Bulls remain in control of the medium-term trend.
 English
 Русский
 Bahasa Indonesia
 Bahasa Malay
 ไทย
ไทย Español
 Deutsch
 Български
 Français
 Tiếng Việt
 中文
中文 বাংলা
বাংলা हिन्दी
 Čeština
 Українська
 Română

