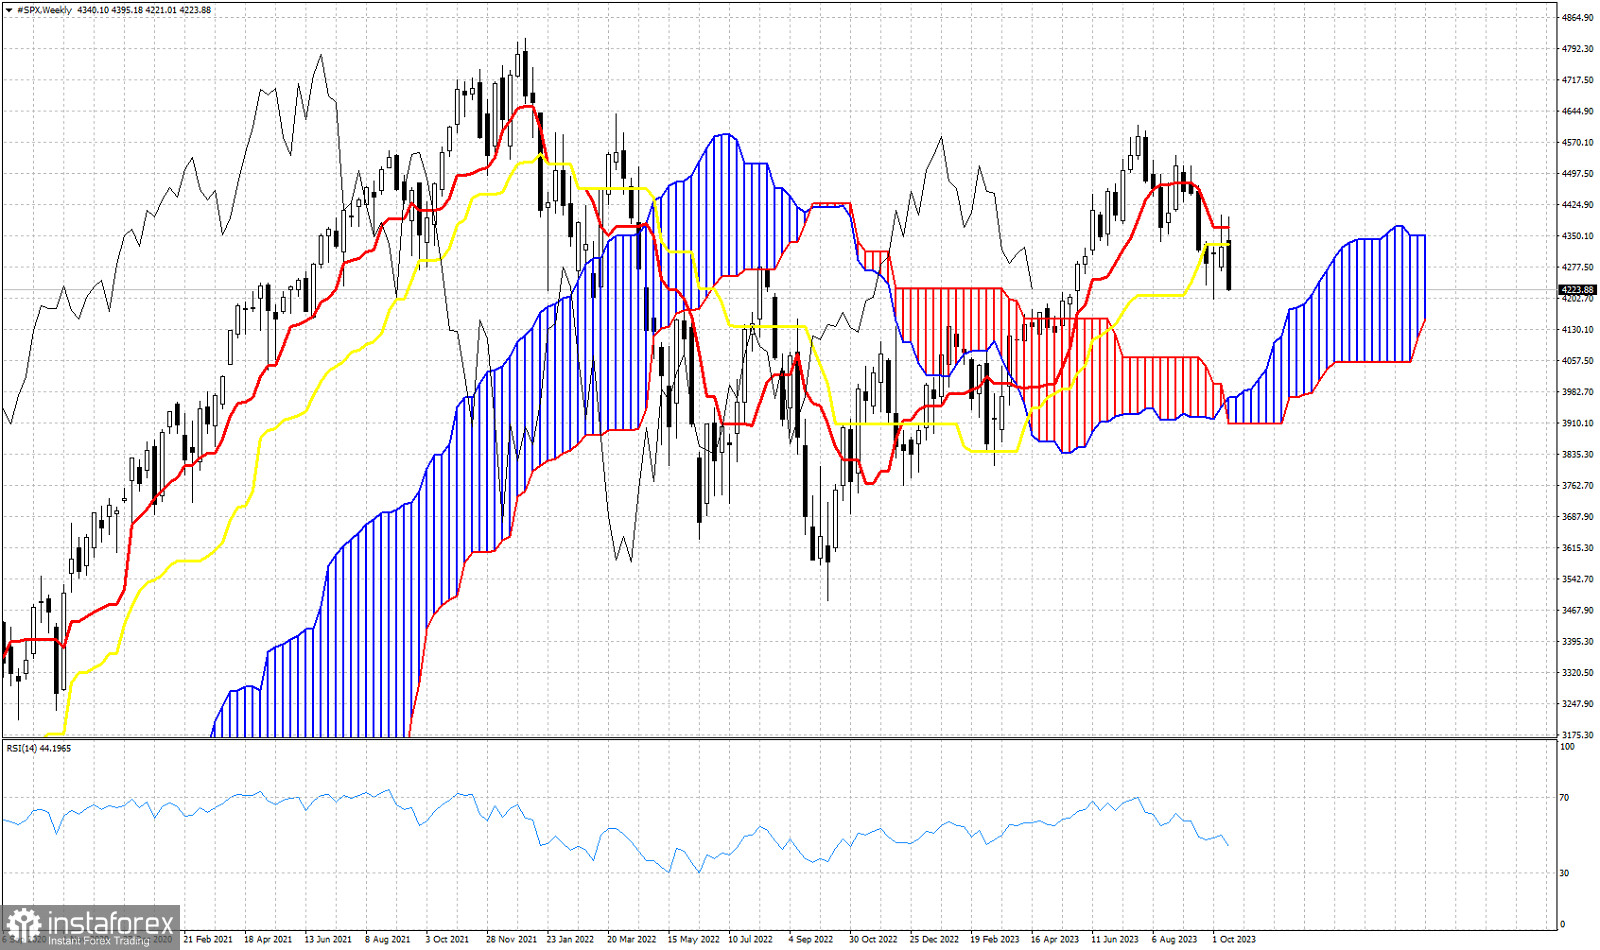
In a previous analysis we used the Ichimoku cloud indicator in the Daily chart to analyse its current market profile. As we mentioned in our analysis, trend was bearish because price was below the Kumo (cloud) and the index was vulnerable to a move lower. The week ended with SPX making new lows as expected. The index closed at new lower lows since June. Today we check the Ichimoku cloud indicator in the weekly chart. The last two weeks bulls tried to push price above the tenkan-sen (red line indicator) but price got rejected. Recent price action confirms the importance of the resistance area of 4,330-,4370 where we also find the kijun-sen (yellow line indicator). The Chikou span (black line indicator) is above the candlestick pattern (bullish) but with a negative slope. Trend on a weekly basis is bullish because price is above the Kumo, but with price breaking below both the tenkan-sen and kijun-sen, we conclude that the index is vulnerable to a move lower towards the weekly Kumo (cloud) support around 4,000-4,050.
 English
 Русский
 Bahasa Indonesia
 Bahasa Malay
 ไทย
ไทย Español
 Deutsch
 Български
 Français
 Tiếng Việt
 中文
中文 বাংলা
বাংলা हिन्दी
 Čeština
 Українська
 Română

