5M chart of EUR/USD

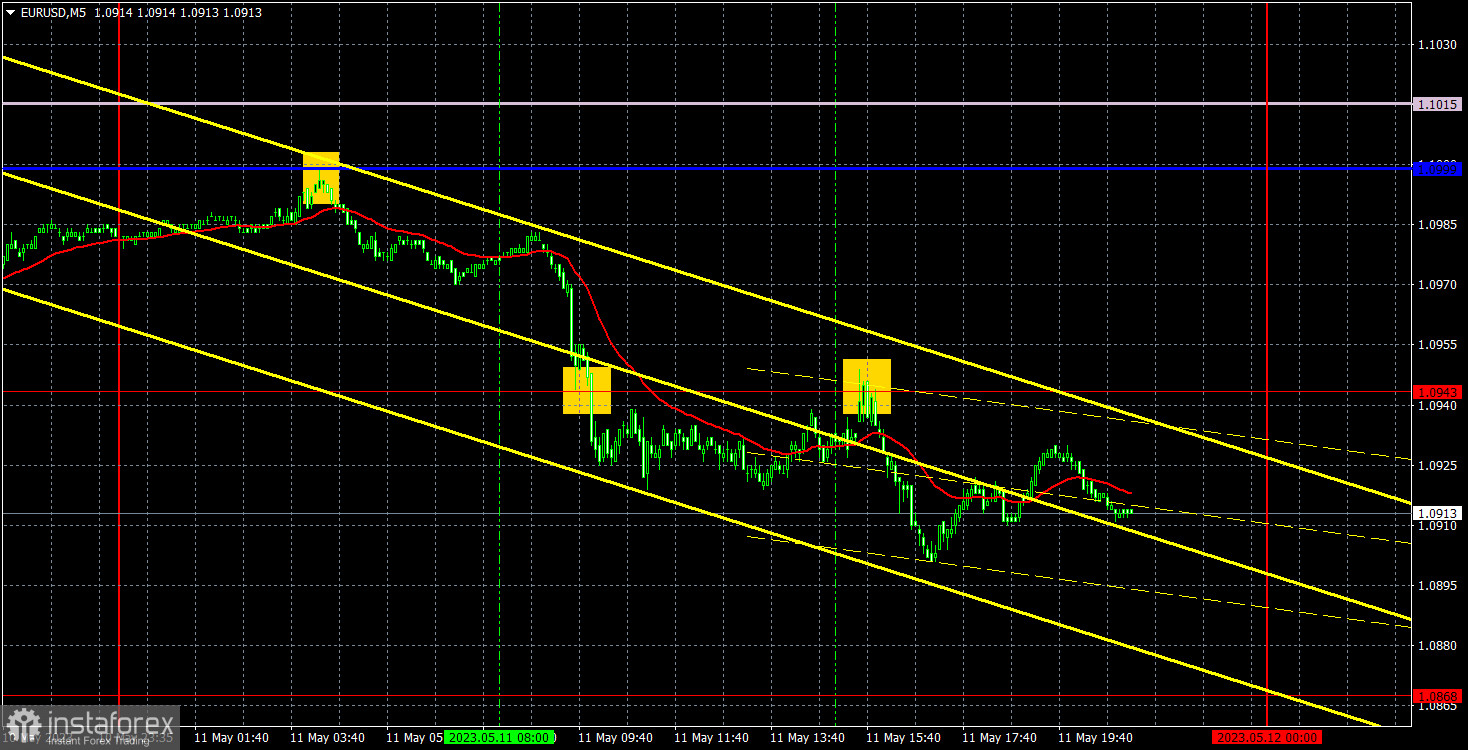
On Thursday, the EUR/USD pair continued to trade lower. There were no important events in either the eurozone or the US. Several minor reports were published in America, and each one worked against the dollar instead of providing support for it. However, the euro started to fall in the morning even when there was no data in sight. In the second part of the day, the results of the Bank of England's meeting were announced, and BoE Governor Andrew Bailey delivered a speech. The pound justifiably fell after these events and pulled the euro with it, which I had warned you about yesterday. Thus, both for technical and fundamental reasons, the pair had good reasons to fall on Thursday.
There were several trading signals on Thursday, and the first one was formed overnight. The rebound from the critical line could be used as a signal when the European trading session opened, by that time the pair had only gone down 6 points. Subsequently, the pair crossed the 1.0943 level, so traders could stay in short positions, and even with a Stop Loss set to breakeven. Therefore, it was safe to stay in the position even during the announcement of the results of the BoE's meeting. By the end of the day, the pair failed to drop to the next target - 1.0868, so the position had to be closed manually with a profit of about 60 points.
COT report:

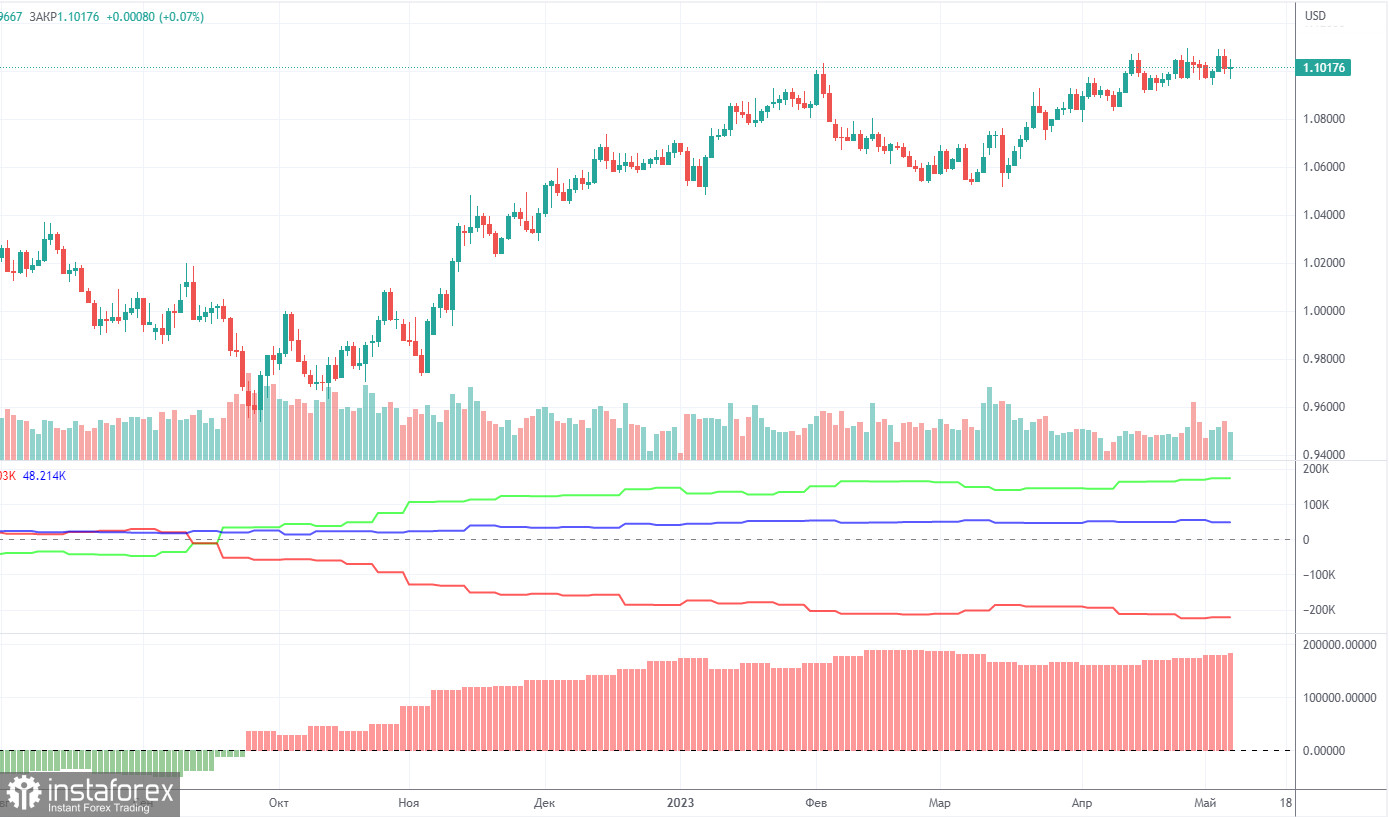
On Friday, a new COT report was released for May 2. In the past 8-9 months, the COT report data has been completely in line with market developments. The illustration above clearly shows that the net position of large market players (second indicator) began to grow in September 2022. Around the same time, the European currency also began to appreciate. Currently, the net position of the non-commercial group of traders remains bullish and so does the position of the European currency, which is hesitating to develop a proper downward correction.
We have previously drawn your attention to the fact that a relatively high net position value suggests a possible end of the uptrend. This is signaled by the first indicator where the red and green lines have moved significantly away from each other, which often precedes the end of a trend. The European currency attempted to start a decline, but we only saw a simple pullback. During the last reporting week, the number of Buy contracts in the non-commercial group of traders increased by 3,300, while the number of Sell contracts decreased by 700. Accordingly, the net position grew again by 4,000 contracts. The number of BUY contracts is higher than the number of SELL contracts among non-commercial traders by 174,000, which is very significant. The difference is almost threefold. A correction is still overdue, so even without COT reports, it is clear that the pair should start falling. However, we still only see an upward movement.
1H chart of EUR/USD

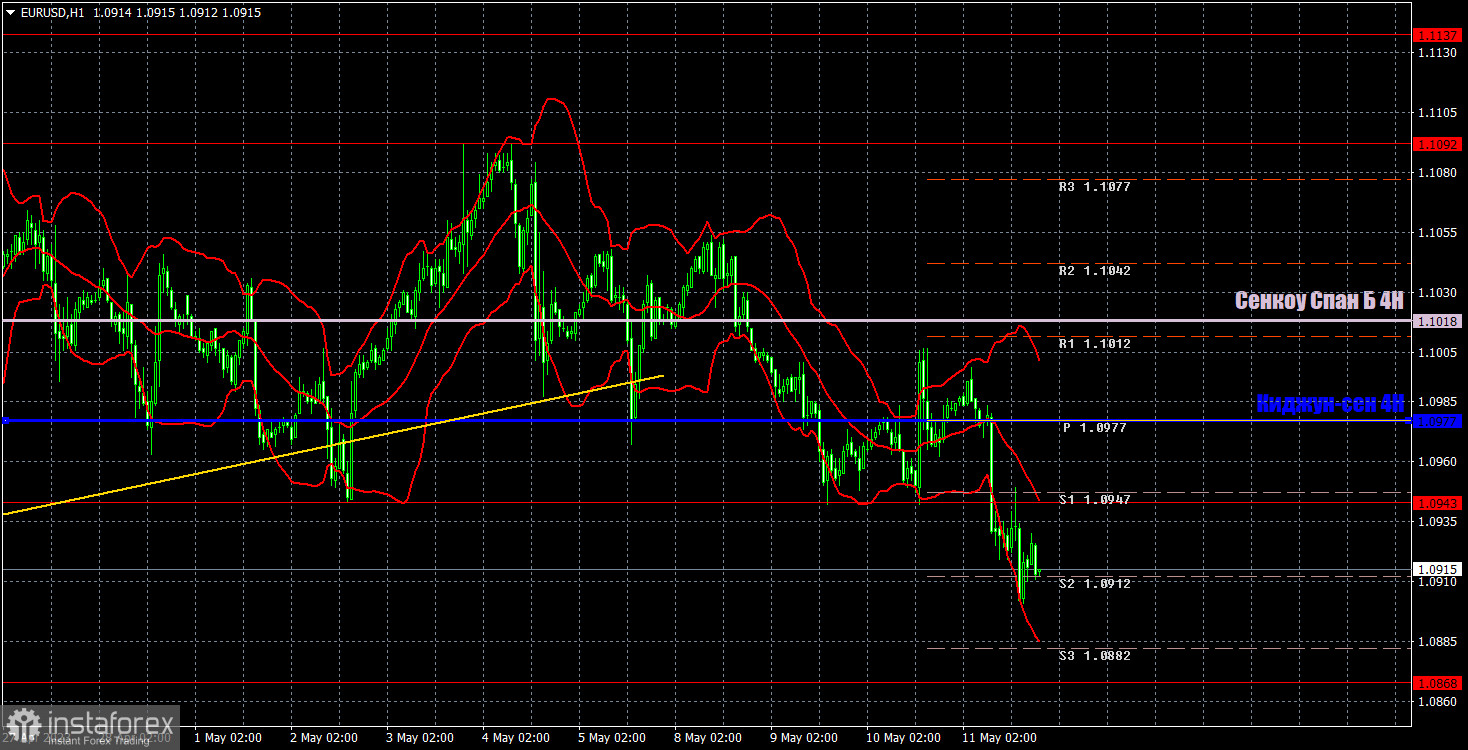
On the 1-hour chart, the pair broke the ascending trend line and continues its downward movement. It also crossed the lines of the Ichimoku indicator, so for the first time in two months, the pair is finally falling after forming strong sell signals. We even got used to its behavior. Naturally, we expect the euro to trade lower, regardless of the fundamental and macroeconomic background.
On Friday, important levels are seen at 1.0762, 1.0806, 1.0868, 1.0943, 1.1092, 1.1137-1.1185, 1.1234, as well as Senkou Span B lines (1.1018) and Kijun-sen (1.0977) lines. Ichimoku indicator lines can move intraday, which should be taken into account when determining trading signals. There are also support and resistance although no signals are made near these levels. They could be made when the price either breaks or rebounds from these extreme levels. Do not forget to place Stop Loss at the breakeven point when the price goes by 15 pips in the right direction. In case of a false breakout, it could save you from possible losses.
On May 12 in the eurozone, Luis de Guindos will speak, and in the US, we have Michelle Bowman and James Bullard. But the speeches of the Federal Reserve members will take place late in the evening, which is when the market will be closing. Also, the University of Michigan's consumer sentiment index will be published, which is unlikely to surprise traders enough for them to react to it with active longs or shorts.
Indicators on charts:
Resistance/support - thick red lines, near which the trend may stop. They do not make trading signals.
Kijun-sen and Senkou Span B are the Ichimoku indicator lines moved to the hourly timeframe from the 4-hour timeframe. They are also strong lines.
Extreme levels are thin red lines, from which the price used to bounce earlier. They can produce trading signals.
Yellow lines are trend lines, trend channels, and any other technical patterns.
Indicator 1 on the COT chart is the size of the net position of each trader category.
Indicator 2 on the COT chart is the size of the net position for the Non-commercial group of traders.
 English
 Русский
 Bahasa Indonesia
 Bahasa Malay
 ไทย
ไทย Español
 Deutsch
 Български
 Français
 Tiếng Việt
 中文
中文 বাংলা
বাংলা हिन्दी
 Čeština
 Українська
 Română

