EUR/USD

Higher timeframes
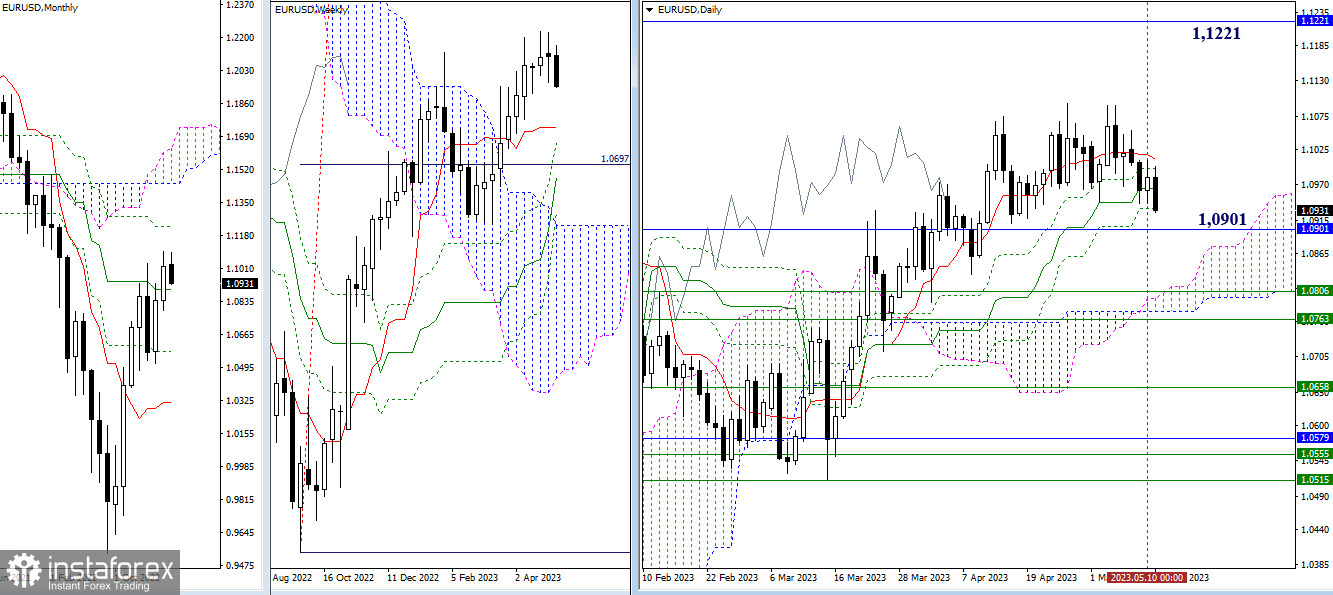
Yesterday, the situation did not undergo significant changes. The pair remained in the area of attraction and influence of the daily Ichimoku cross levels (1.1017 – 1.0995 – 1.0964 – 1.0933). The main task for the bears in this market segment is the liquidation of the daily golden cross and consolidation under the monthly support of the medium-term trend (1.0901). The target for the bulls has not changed its location, remaining at 1.1221, but to test it, the bulls must leave the current consolidation zone, updating the local high at 1.1096.

H4 - H1
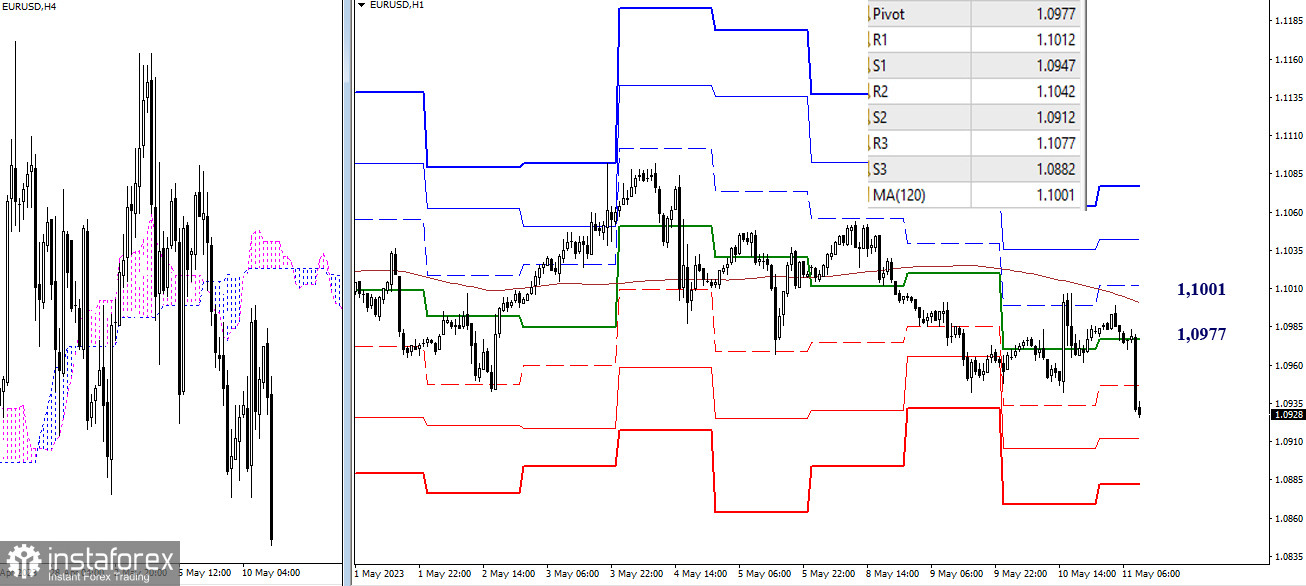
The bears retained their advantage since yesterday. Ahead are the supports of the classic pivot points (1.0912 – 1.0882). The key levels of the lower timeframes at 1.0977 (central pivot point), 1.1001 (weekly long-term trend) currently form the frontiers of the most important resistances, the breakdown of which can change the current balance of power.
GBP/USD

Higher timeframes
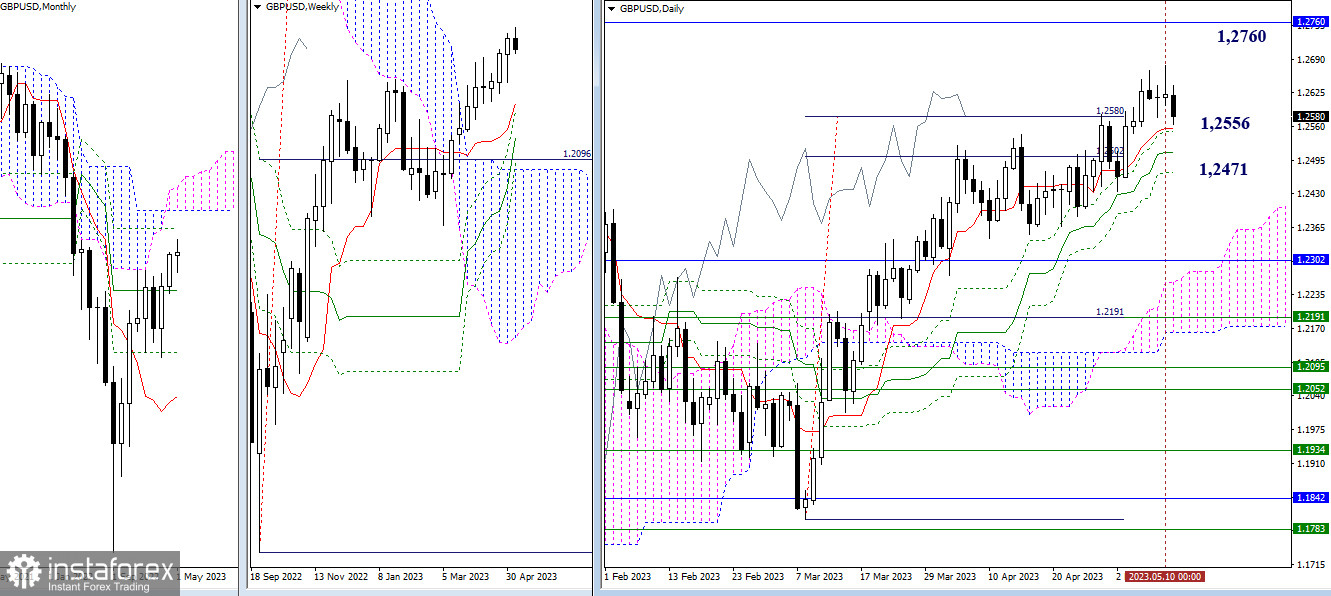
Bulls again lost their initiative after updating last week's high. The closing level of monthly Ichimoku cross (1.2760) remains the nearest target for the rise. The support zone in case of the development of a downward movement is now formed by the levels of the daily golden cross (1.2556 – 1.2510 – 1.2471).

H4 - H1
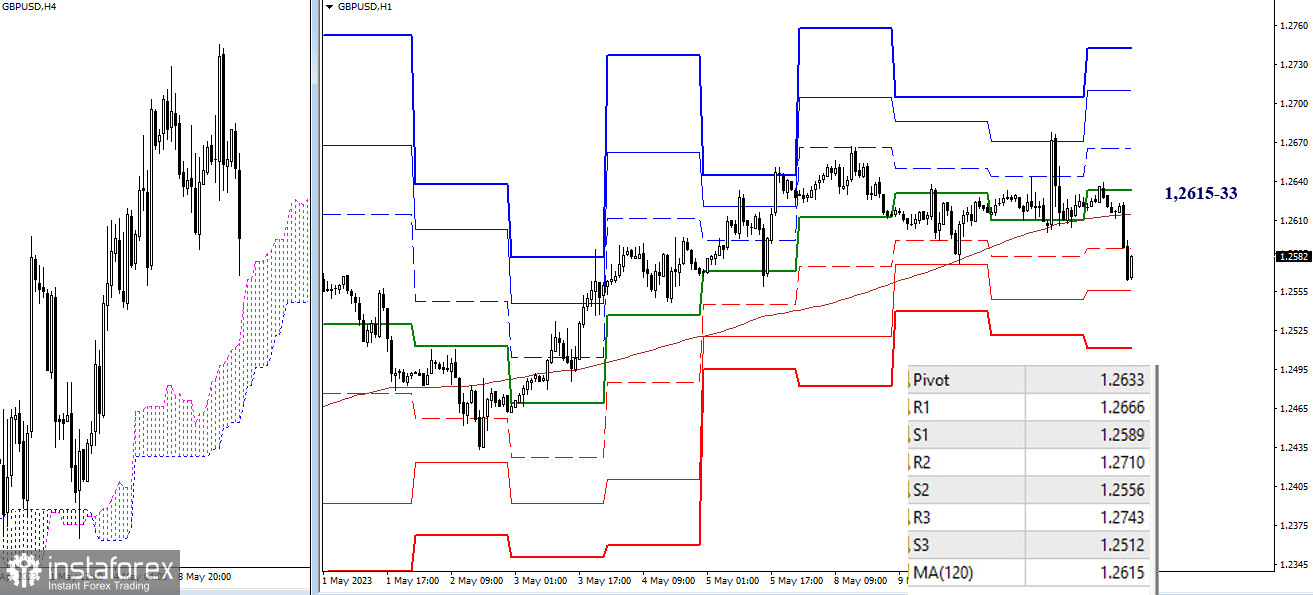
Bears broke the key support, which is the weekly long-term trend (1.2615), and now they are trying to consolidate their advantage. The next downside targets are 1.2556 and 1.2512 (classic pivot points). The key levels are currently forming a resistance zone, which is located in the range of 1.2615–33 (central pivot point of the day + weekly long-term trend). For new bullish prospects to emerge, bulls need to reclaim the key levels.
The technical analysis of the situation uses:
Higher timeframes - Ichimoku Kinko Hyo (9.26.52) + Fibo Kijun levels
Lower timeframes - H1 - Pivot Points (classic) + Moving Average 120 (weekly long-term trend)
 English
 Русский
 Bahasa Indonesia
 Bahasa Malay
 ไทย
ไทย Español
 Deutsch
 Български
 Français
 Tiếng Việt
 中文
中文 বাংলা
বাংলা हिन्दी
 Čeština
 Українська
 Română

