The current week can be called bearish for Bitcoin. The asset fell to the local support zone of $28k, and then continued its downward movement to the important accumulation level near $27.5k. This was accompanied by a constant decrease in trading activity and bearish signals on technical indicators.
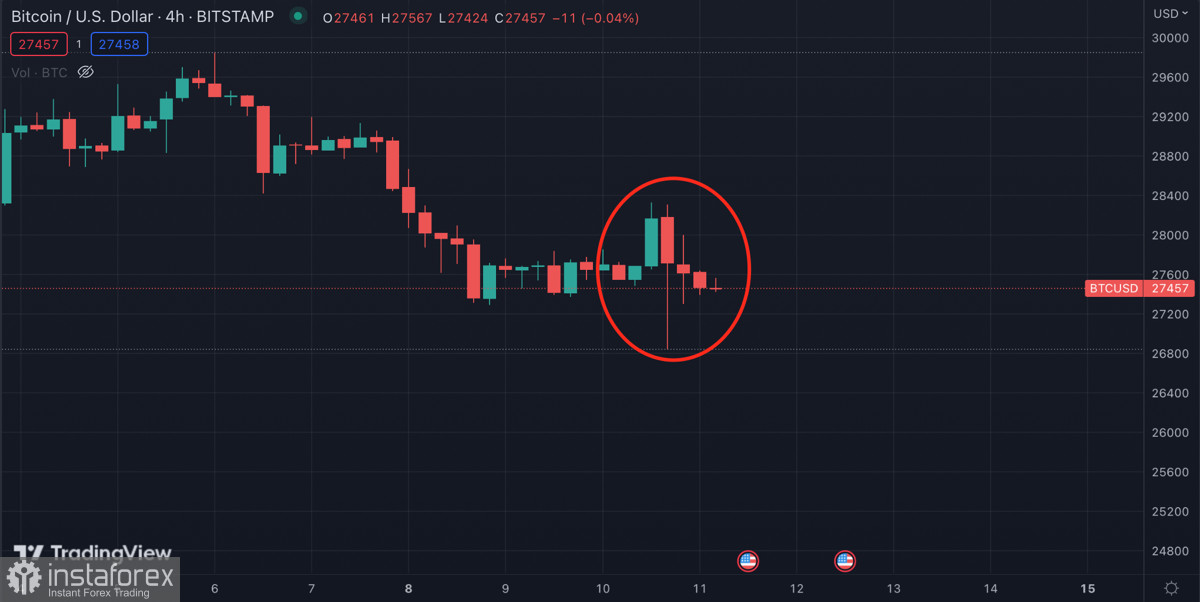
The main technical reason for this was the unsuccessful retest of the $30k level, which occurred on May 6. Subsequently, the cryptocurrency price reversed to the lower boundary of the current range of fluctuations. However, due to the imminent publication of inflation data, the bears were able to exacerbate the situation.
Inflation Data
Bitcoin remains highly dependent on the macroeconomic situation and the actions of the Fed. A significant reduction in trading activity and minimal price movement of BTC prove this directly. The Consumer Price Index (CPI) is a key indicator of the regulator's future actions, and therefore its significance for the BTC price movement is great.
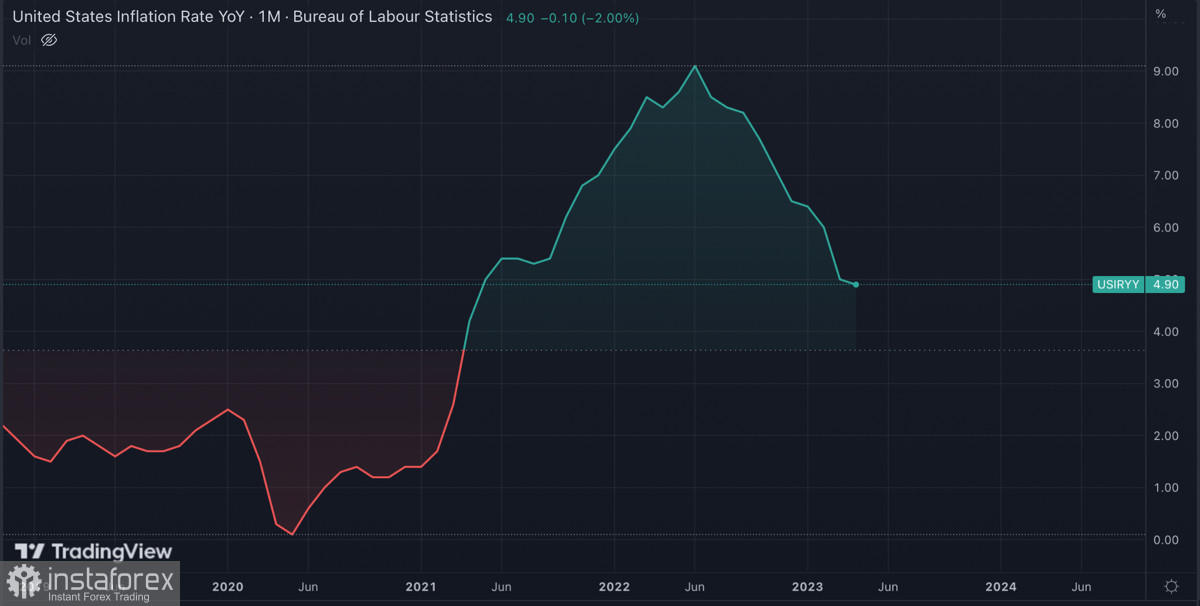
Analysts predicted that the CPI would remain at 5% despite a 25 basis point rate hike in May. In the end, the inflation rate fell to 4.9%, and despite the local positive, it did not radically change the macroeconomic situation.
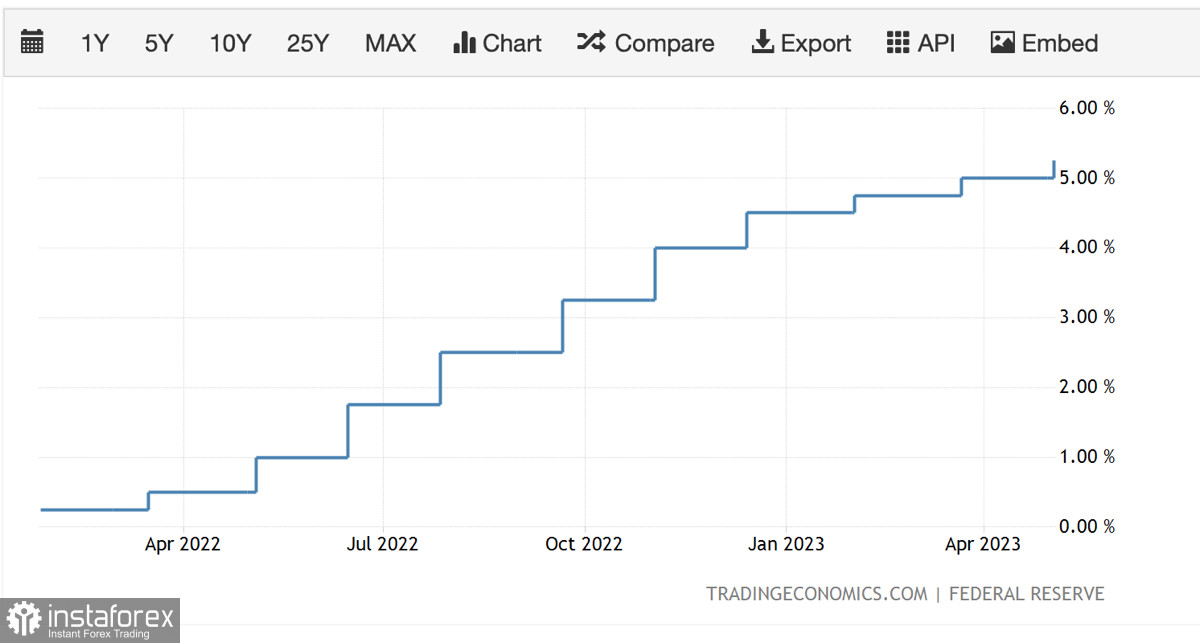
Markets expect a pause in the rate hike cycle in June, which will positively affect financial markets. Despite the positivity associated with inflation, the U.S. Bipartisan Policy Center states that the state expects a default on foreign debt from early June to early August.
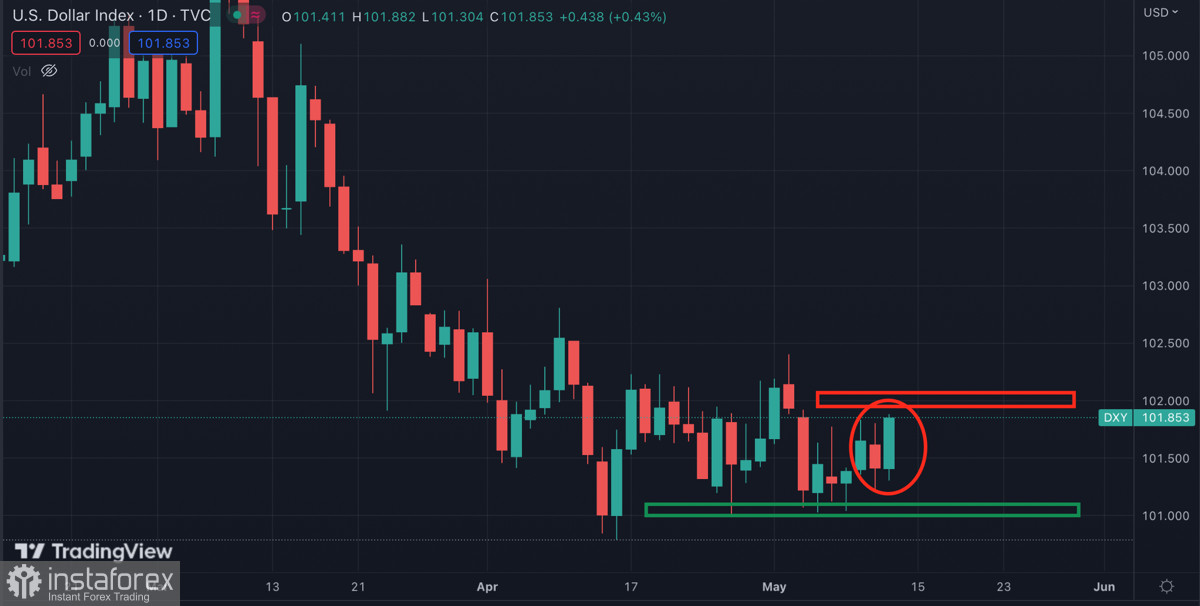
Also, S&P Global lowered the forecast for U.S. GDP growth in 2024 from 1.5% to 0.9%. Despite this, Goldman Sachs and Bloomberg stated that the recession of the U.S. economy in 2023 is still canceled. Against the background of all events, the U.S. dollar index showed local growth and formed a "bullish absorption."
BTC/USD Analysis
Bitcoin reflected all the above events ambiguously. The BTC market became a field for manipulation, its price is currently at the $28.3k level, and then tested the support area at $26.8k. As a result, in just a few hours, shorts and longs were liquidated for more than $100 million.
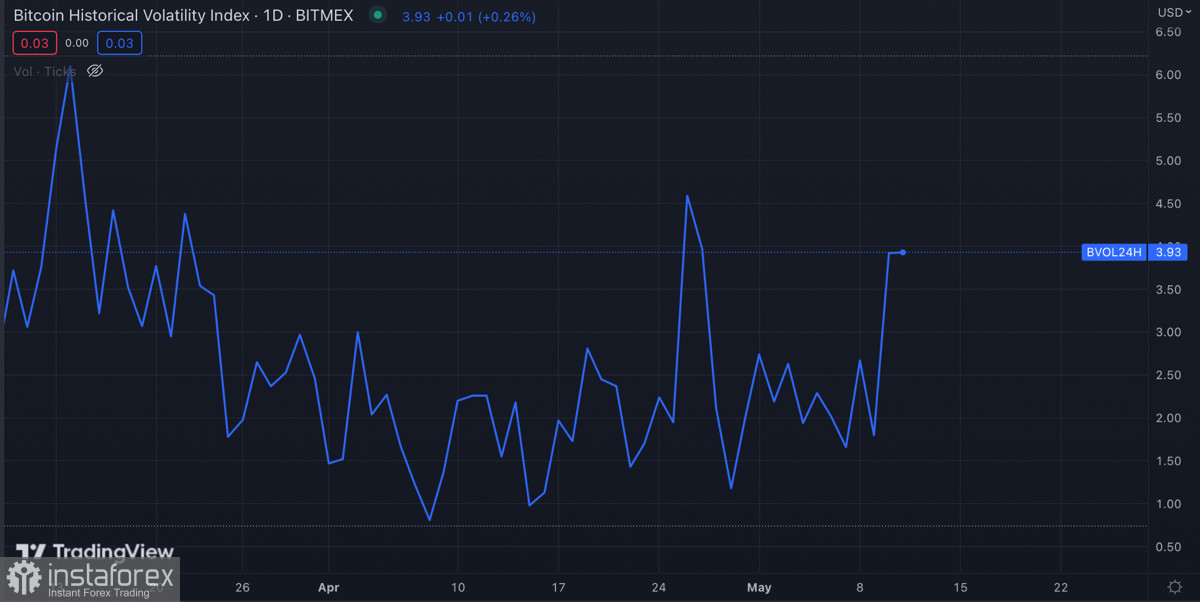
As of 08:00 UTC, Bitcoin is trading near the $27.5k level, and at the end of yesterday's trading day, the asset formed an uncertain "doji" candle. The cryptocurrency's technical metrics indicate another decrease in trading activity and are moving flat. However, overall the situation remains bearish.
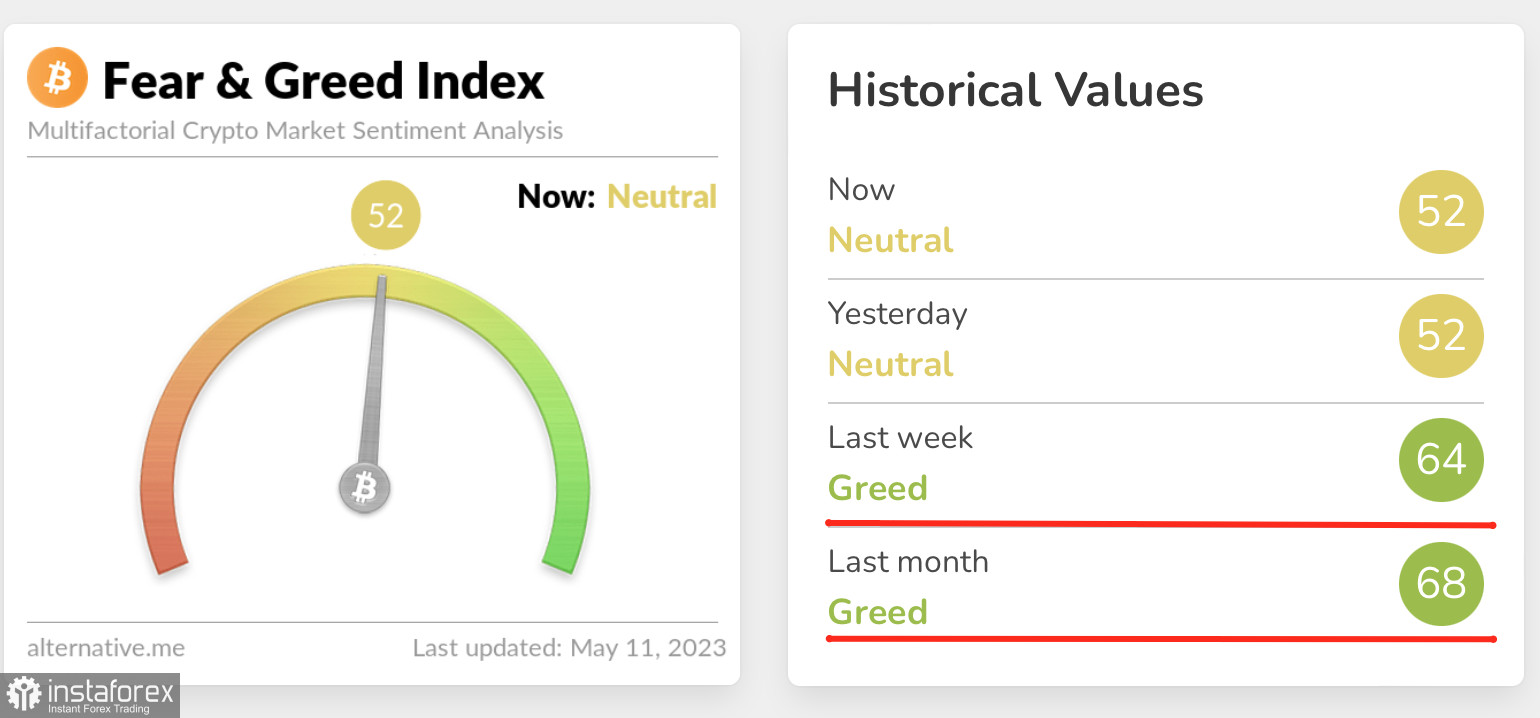
At the same time, Santiment analysts note a sharp increase in short positions on BTC. The last time similar dynamics were observed was in mid-March, before the start of the cryptocurrency's bull rally to $30k. It is quite likely that the dip below $27k only exacerbated the bearish sentiment.
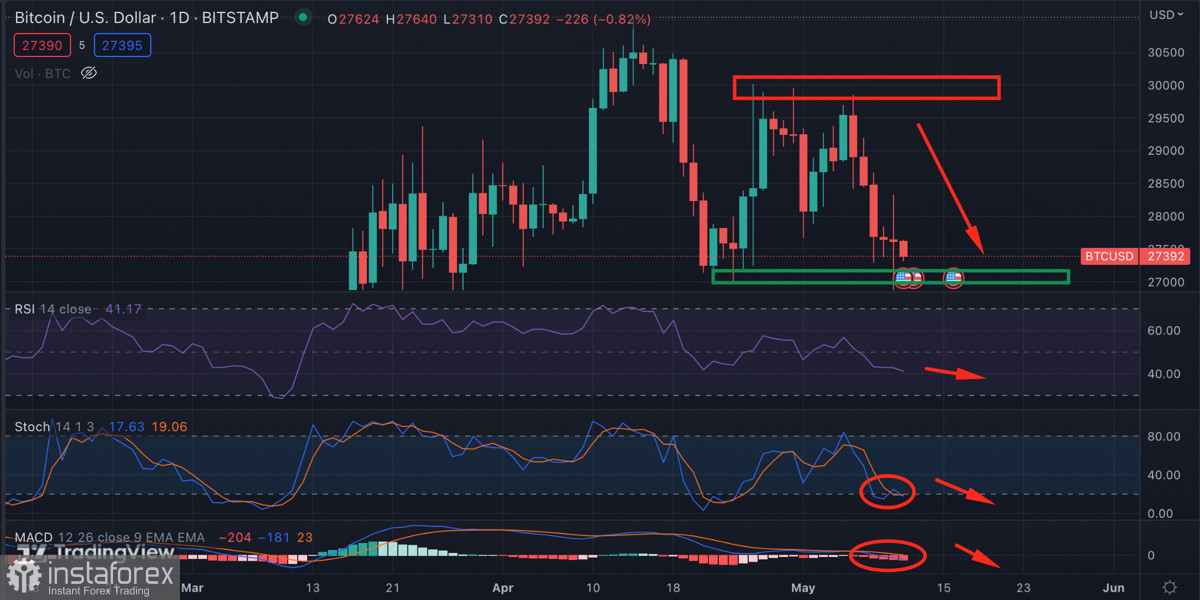
As of May 11, the fear and greed index remains in the neutral values range. However, in weekly and monthly terms, market sentiments are evaluated at the "greed" level. Considering this, it can be assumed that the BTC correction will continue for some time until market sentiments cool down.
Summary
Over the last two weeks, Bitcoin has tested the $27k support zone three times. If we follow the rule that the more often the price tests a level, the more likely it is to fall, and also the objective need to gather liquidity below $26k–$26.5k, we can expect further BTC decline.
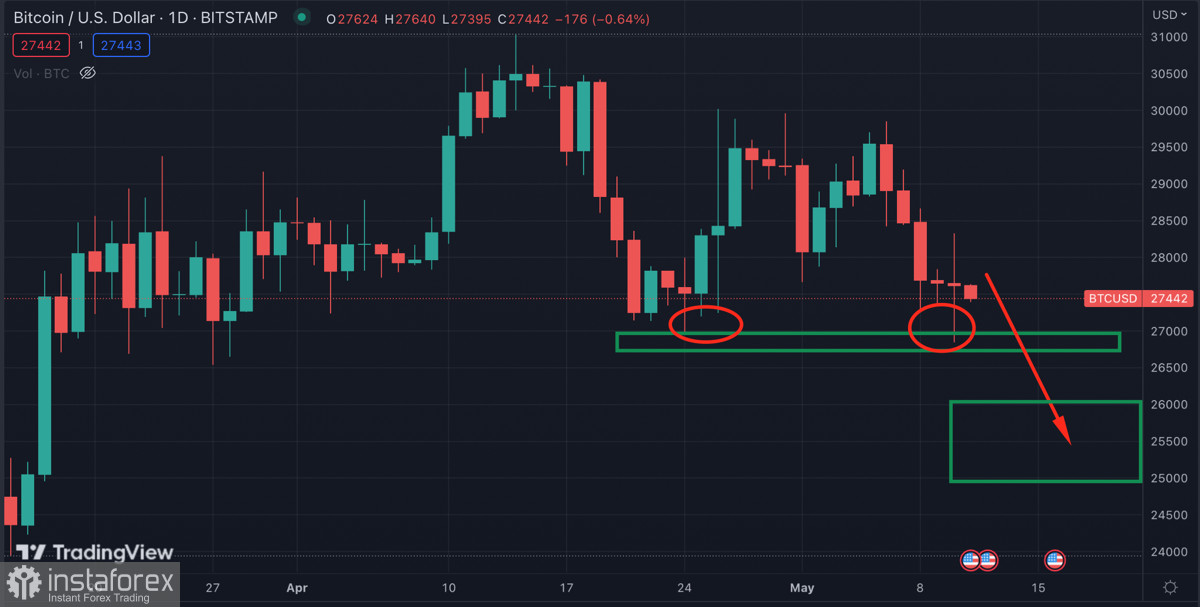
This is also necessary for cooling market sentiments. Considering this, in the near future, the $25k level will become a key zone that bulls need to hold.
 English
 Русский
 Bahasa Indonesia
 Bahasa Malay
 ไทย
ไทย Español
 Deutsch
 Български
 Français
 Tiếng Việt
 中文
中文 বাংলা
বাংলা हिन्दी
 Čeština
 Українська
 Română

