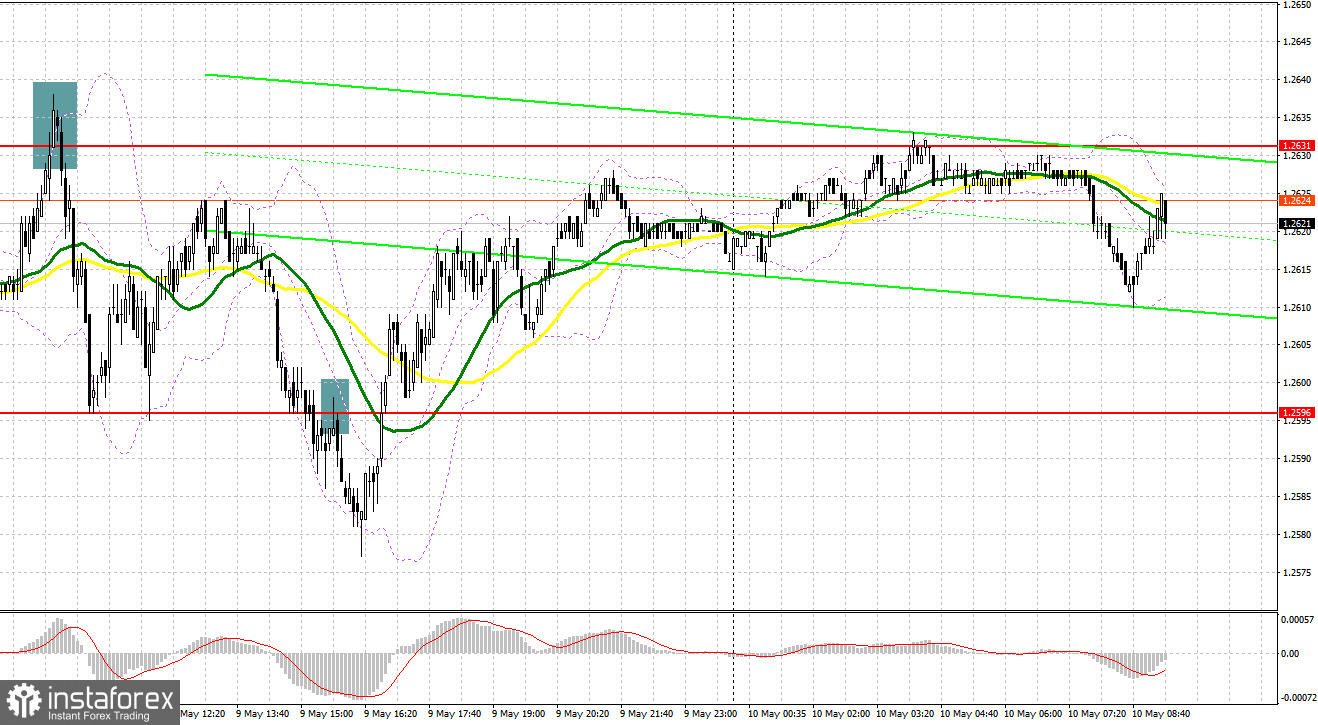
Yesterday, there were several entry points. Now, let's look at the 5-minute chart and figure out what actually happened. In my morning article, I turned your attention to 1.2627 and recommended making decisions with this level in focus. A rise and a false breakout of this level gave an excellent entry point into short positions. It triggered a drop of more than 30 pips. In the afternoon, the breakout and the upward retest of 1.2596 led to another sell signal. However, the downward movement was about 20 pips. After that, demand for the pound sterling revived.

When to open long positions on GBP/USD:
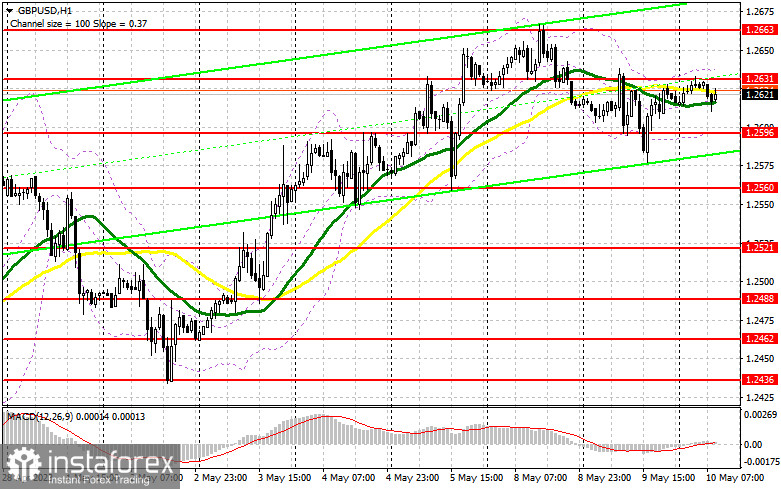
Bulls are definitely taking advantage of the pair's correction and opening long positions on the pound sterling at good prices, especially before the US inflation data and the Bank of England's rate decision. The UK will also unveil economic reports today. The pound sterling may try to rise above 1.2631. However, the British currency has grown considerably recently and further upward movement without strong drivers looks unlikely. So in my opinion, it is better to open long positions on a correction near the support level of 1.2596, formed yesterday. A false breakout there will provide a buy signal with the prospect of further recovery to 1.2631. A breakout and consolidation above this level will give new entry points into long positions with a jump to a monthly high of 1.2663. A more distant target will be the 1.2709 level where I recommend locking in profits.
If GBP/USD declines to 1.2596 and bulls show no activity, the upward movement will persist. However, there could be a deeper correction. In this case, it is better to postpone long positions until a false breakout of 1.2560. You could buy GBP/USD immediately at a bounce from 1.2521, keeping in mind an upward intraday correction of 30-35 pips.
When to open short positions on GBP/USD:
Sellers are trying really hard but they are unable to initiate a strong downward correction. In case of another rise that may occur in the morning, bears need to push the pair below 1.2631 where the moving averages are passing. If the pair fails to break above this level and there is no false breakout, pressure on the pound sterling could increase. It may decline to 1.2596. A breakout and an upward retest of this level will provide a sell signal with a drop to 1.2560. A more distant target will be the 1.2521 level where I recommend locking in profits.

If GBP/USD rises and bears show no energy at 1.2631, I would advise you to postpone short positions until the test of the monthly high of 1.2663. Only a false breakout there will give an entry point into short positions. If there is no downward movement there, you could sell GBP/USD at a bounce from 1.2709, keeping in mind a downward intraday correction of 30-35 pips.
COT report
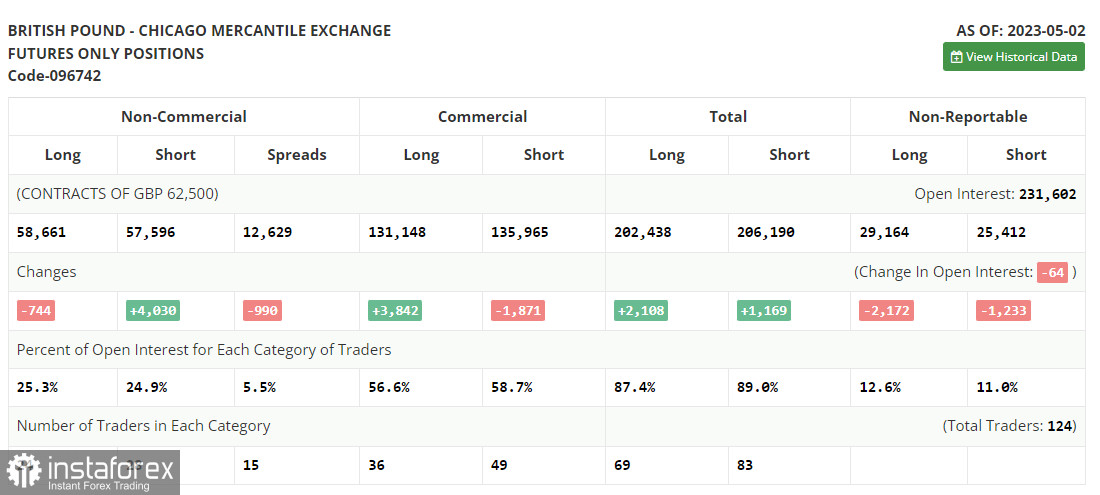
According to the COT report (Commitment of Traders) for May 2, there was an increase in short positions and a decline in long ones. The Bank of England is widely expected to hike the rate this week. The regulator has been trying to tame inflation for quite a long time. However, it failed to achieve any positive results. The pound sterling will hardly climb if the BoE raises the key rate by 0.25% basis points. Traders have already priced it in. Hence, a deeper correction looks likely this week. The latest COT report showed that short non-profit positions increased by 4,030, to 57,596, while long non-profit positions slid by 744, to 58,661. It led to a decrease in the non-commercial net position to 1,065 against 5,839 a week earlier. This was the first decline in six weeks. So, it was just a correction. The weekly price rose to 1.2481 against 1.2421.

Indicators' signals:
Trading is carried out near the 30 and 50 daily moving averages, which indicates a sideways movement.
Moving averages
Note: The period and prices of moving averages are considered by the author on the H1 (1-hour) chart and differ from the general definition of the classic daily moving averages on the daily D1 chart.
Bollinger Bands
If GBP/USD declines, the indicator's lower border at 1.2596 will serve as resistance.
Description of indicators
- Moving average (moving average, determines the current trend by smoothing out volatility and noise). Period 50. It is marked yellow on the chart.
- Moving average (moving average, determines the current trend by smoothing out volatility and noise). Period 30. It is marked green on the chart.
- MACD indicator (Moving Average Convergence/Divergence - convergence/divergence of moving averages) Quick EMA period 12. Slow EMA period to 26. SMA period 9
- Bollinger Bands (Bollinger Bands). Period 20
- Non-commercial speculative traders, such as individual traders, hedge funds, and large institutions that use the futures market for speculative purposes and meet certain requirements.
- Long non-commercial positions represent the total long open position of non-commercial traders.
- Short non-commercial positions represent the total short open position of non-commercial traders.
- Total non-commercial net position is the difference between the short and long positions of non-commercial traders.
 English
 Русский
 Bahasa Indonesia
 Bahasa Malay
 ไทย
ไทย Español
 Deutsch
 Български
 Français
 Tiếng Việt
 中文
中文 বাংলা
বাংলা हिन्दी
 Čeština
 Українська
 Română

