USD/JPY
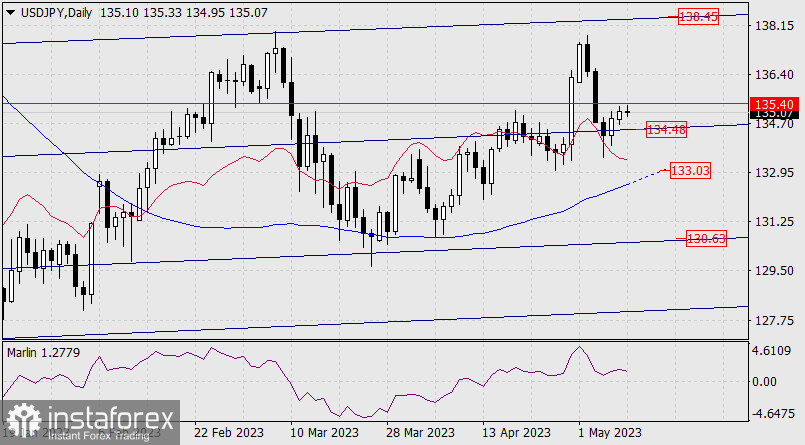
Recently, the USD/JPY pair has been staying above the support of the embedded price channel line of the higher chart (134.48). Now there are two options: put in more effort and consolidate above the resistance of 135.40 and gain the opportunity to advance to 138.45 - the upper embedded line of the price channel. Or consolidate below the lower line (134.48) and resume the decline to the MACD line on the daily chart, around the 133.03 mark.

The Marlin oscillator is in the positive area and gives a slight advantage to the growth option.
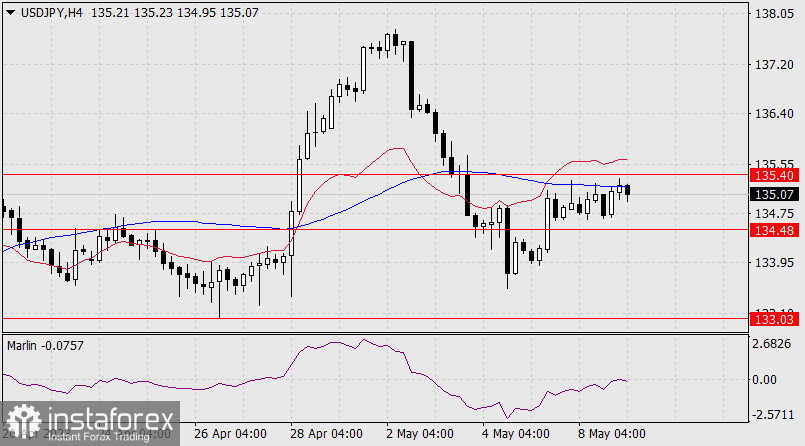
On the four-hour chart, the price reached the resistance of the MACD indicator line simultaneously touching the limit (0.00) by the Marlin oscillator's signal line.

This pattern - the synchronization of the lines on the chart and the oscillator enhances the potential of the upcoming impulsive movement - either upward or a reversal downward.
In all other respects, the 4-hour chart currently does not provide additional information. To move upward, the price must consolidate above 135.40; to move downward, it must consolidate below 134.48.
 English
 Русский
 Bahasa Indonesia
 Bahasa Malay
 ไทย
ไทย Español
 Deutsch
 Български
 Français
 Tiếng Việt
 中文
中文 বাংলা
বাংলা हिन्दी
 Čeština
 Українська
 Română

