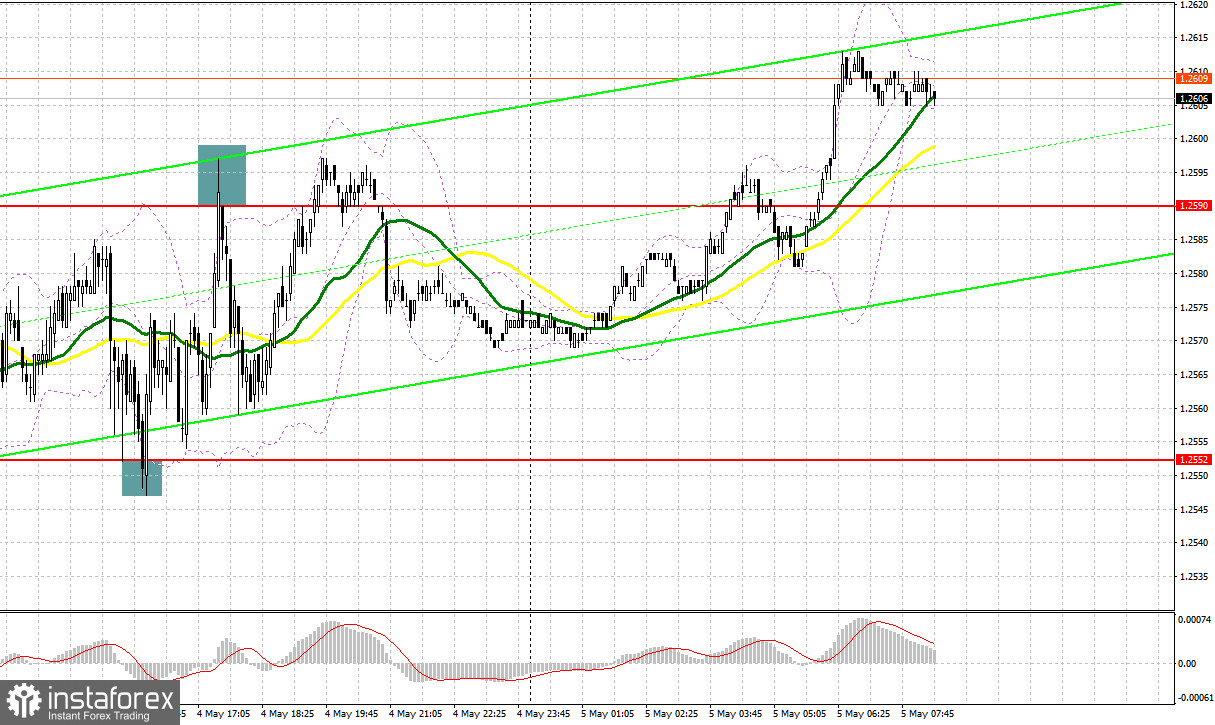
Yesterday, there were several entry points. Now, let's look at the 5-minute chart and figure out what actually happened. In my morning article, I turned your attention to 1.2562 and recommended making decisions with this level in focus. A decline and false breakout of this level gave an excellent entry point into long positions. I was counting on the continuation of the bullish scenario. The pair rose by about 20 pips. In the afternoon, the bulls managed to defend the support level of 1.2552 which provided a buy signal with a rise to 1.2595.

When to open long positions on GBP/USD:
Strong data on the US Services PMI Index for April boosted demand for the pound sterling. Today, traders are anticipating the UK Construction PMI Index. If the fresh figures are upbeat, the pound sterling is likely to climb higher. Given that the Bank of England meeting is on tap next week, bulls could increase their long positions.
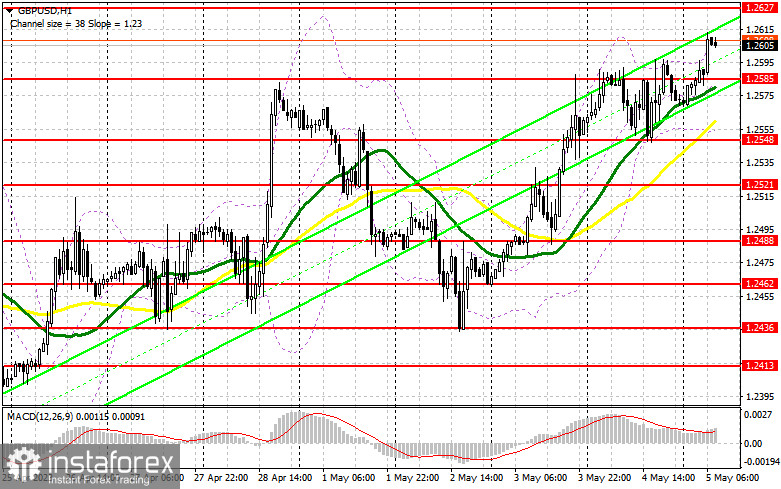
I would like to see a correction of the pair to the support area of 1.2585, formed yesterday. The moving averages which are benefiting bulls are passing there. A false breakout there will provide a buy signal with the prospect of further recovery to 1.2627, a new monthly high. A breakout and consolidation above this level will provide an additional buy signal with a jump to 1.2663. A more distant target will be the 1.2709 level where I recommend locking in profits.
If the pair declines to 1.2585 and bulls show no activity, the pair is unlikely to hit the monthly high this week. In this case, I will postpone long positions until a false breakout of 1.2548. You could buy GBP/USD at a bounce from 1.2521, keeping in mind an upward intraday correction of 30-35 pips.
When to open short positions on GBP/USD:
Sellers did their best yesterday but managed only to initiate a small downward correction. In case of further growth of the pair, bears need to protect 1.2627. If bulls fail to push the pair above this level and there is a false breakdown, the pressure on the pound sterling will increase. It may drop to 1.2585. A breakout and a downward retest of this level could create a new sell signal. The pair may fall to 1.2548. A more distant target will be the 1.2521 level where I recommend locking in profits.
If GBP/USD climbs and bears show no energy at 1.2627, which is most likely to happen closer to the afternoon, it is better to postpone short positions until the test of the resistance level of 1.2663. Only a false breakout there will give an entry point into short positions. If there is no downward movement there, you could sell GBP/USD at a bounce from 1.2709, keeping in mind a downward intraday correction of 30-35 pips.

COT report
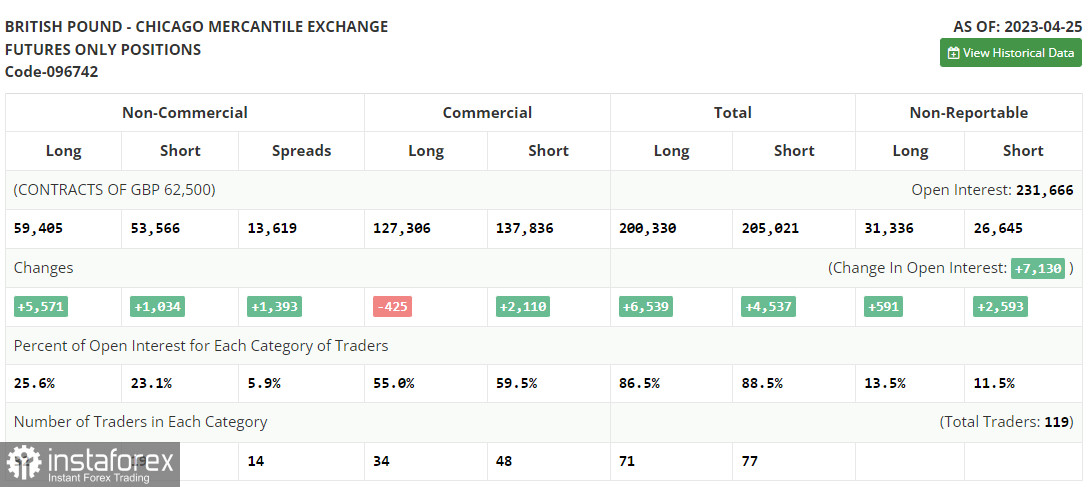
According to the Commitments of Traders (COT) report from April 25, there was an increase in both long and short positions. The Bank of England has no choice but to continue to raise interest rates. The regulator has not achieved any results or progress in taming inflation. In any case, further tightening will boost demand for the pound sterling. Given the current state of the US economy, a stronger pound against the dollar seems likely. The latest COT report showed that non-commercial short positions increased by 1,034 to 53,566, while non-commercial long positions jumped by 5,571 to the level of 59,405. This led to a surge in the non-commercial net position to 5,839 from 1,302 a week earlier. This has been the fifth weekly rise, confirming bullish market sentiment. The weekly closing price fell to 1.2421 from 1.2446.

Indicators' signals:
Trading is carried out above the 30 and 50 daily moving averages, which indicates a further rise in the pound sterling.
Moving averages
Note: The period and prices of moving averages are considered by the author on the H1 (1-hour) chart and differ from the general definition of the classic daily moving averages on the daily D1 chart.
Bollinger Bands
If EUR/USD declines, the indicator's lower border at 1.2548 will serve as support.
Description of indicators
- Moving average (moving average, determines the current trend by smoothing out volatility and noise). Period 50. It is marked yellow on the chart.
- Moving average (moving average, determines the current trend by smoothing out volatility and noise). Period 30. It is marked green on the chart.
- MACD indicator (Moving Average Convergence/Divergence - convergence/divergence of moving averages) Quick EMA period 12. Slow EMA period to 26. SMA period 9
- Bollinger Bands (Bollinger Bands). Period 20
- Non-commercial speculative traders, such as individual traders, hedge funds, and large institutions that use the futures market for speculative purposes and meet certain requirements.
- Long non-commercial positions represent the total long open position of non-commercial traders.
- Short non-commercial positions represent the total short open position of non-commercial traders.
- Total non-commercial net position is the difference between the short and long positions of non-commercial traders.
 English
 Русский
 Bahasa Indonesia
 Bahasa Malay
 ไทย
ไทย Español
 Deutsch
 Български
 Français
 Tiếng Việt
 中文
中文 বাংলা
বাংলা हिन्दी
 Čeština
 Українська
 Română

