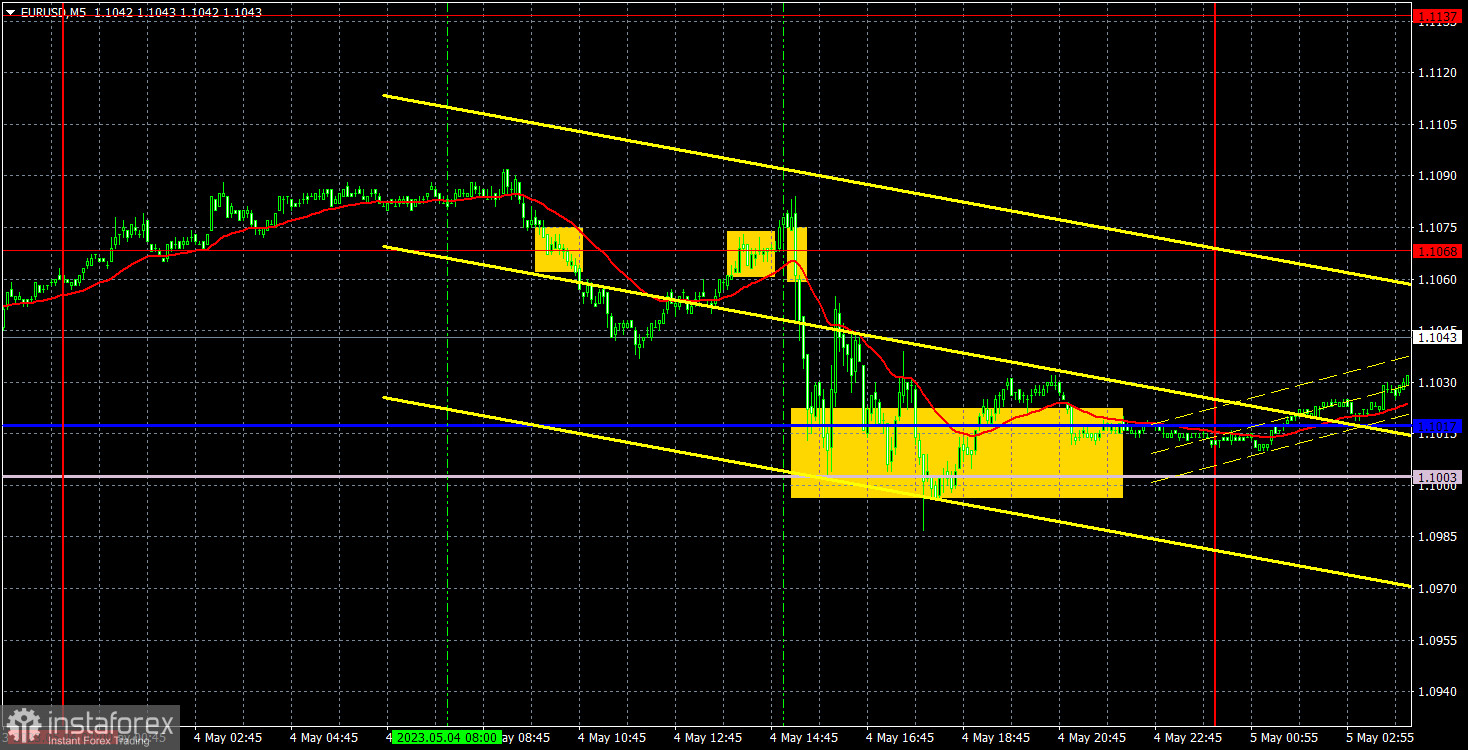
5M chart of EUR/USD

The EUR/USD pair showed a moderate decline on Thursday. Considering that the results of the Federal Reserve meeting were announced on Wednesday evening and the results of the European Central Bank meeting on Thursday afternoon, we expected a more significant movement from the pair. On Thursday, the pair fell by only 100 points throughout the day. Naturally, a 100-point drop cannot break the current uptrend that has been maintained for a long time. The price couldn't even consolidate below the Ichimoku indicator lines!
The ECB raised the rate by 0.25%, thus slowing down the pace of monetary tightening, as we assumed. ECB President Christine Lagarde said that the rate would continue to rise as inflation remains too high, but decisions will be made from meeting to meeting, depending on the information received. On Wednesday evening, the dollar fell after the rate hike, and on Thursday, the euro fell after the rate hike. Both central banks are heading towards the end of the tightening cycle.
Several trading signals were formed on Thursday, but those that were formed during the conclusion of the ECB meeting should obviously not have been worked out. Therefore, traders could open a short position on the first sell signal near the 1.1068 level, after which the pair went down by 20 points. This was enough to set a Stop Loss at breakeven. Subsequently, the pair began to move very emotionally, constantly changing the direction of movement.
COT report:

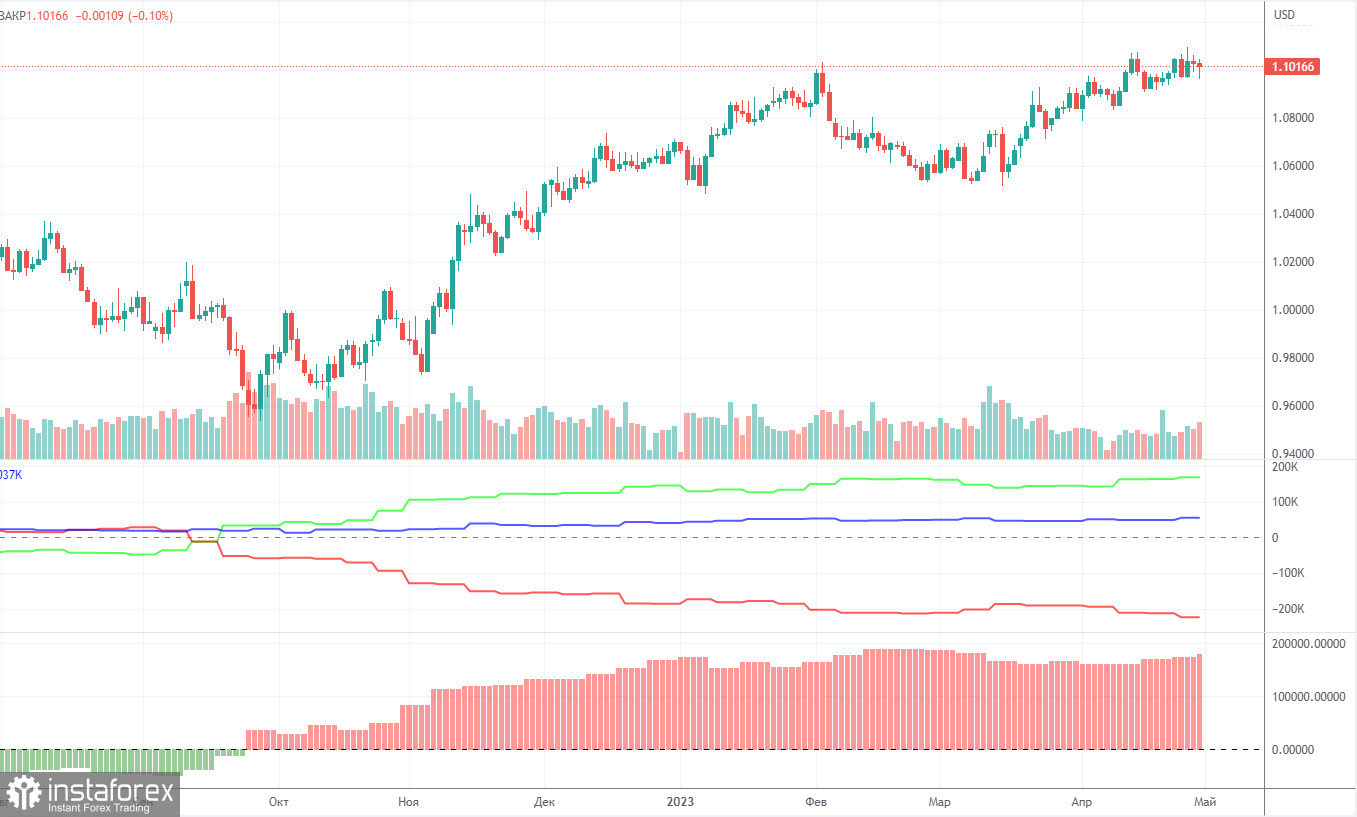
On Friday, a new COT report for April 25 was released. In the last 8-9 months, the COT reports have perfectly reflected what has been happening in the market. The charts above clearly show that the net position of large traders (the second indicator) began to increase in September 2022. At about the same time, the euro resumed a bullish bias. Currently, the net position of non-commercial traders is bullish and remains very high. It boosts further growth of the euro. The high level of the net position signals the competition of the uptrend. The first indicator also points to such a scenario. The red and green lines are very far from each other, which often happens before the end of the trend. The euro tried to resume a downward movement. However, so far, we have seen only a pullback. During the last reporting week, the number of long positions of the non-commercial group of traders increased by 1,100 and the number of short ones dropped by 3,900. The net position advanced by 5,000 contracts. The number of long positions is bigger than the number of short ones. Non-commercial traders already have opened 169,000 long positions. The gap is almost threefold. Investors are still unable to start a correction. Even without COT reports, it is clear that the pair is likely to resume a new fall. Yet, currently, bullish momentum is strong.
1H chart of EUR/USD

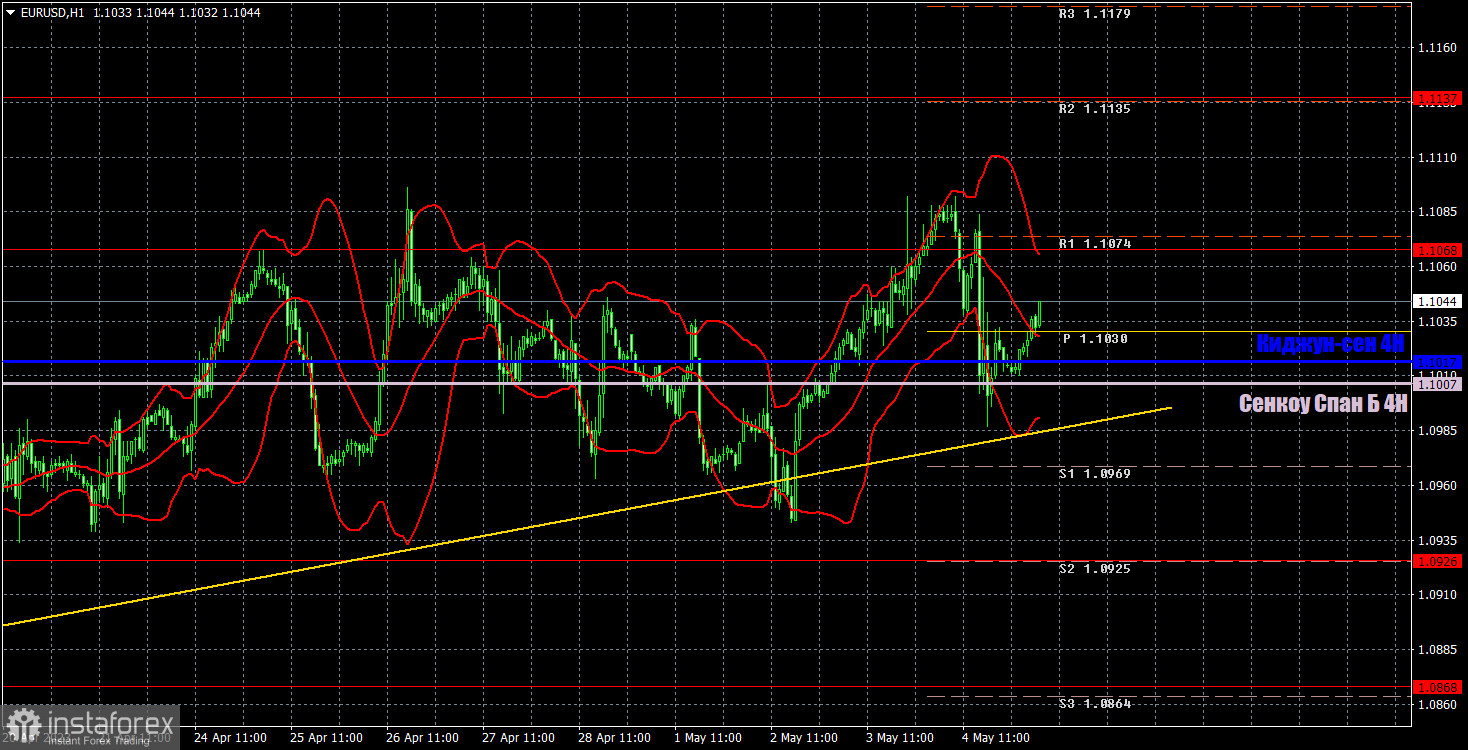
On the one-hour chart, the pair continues to show strange and unreasonable movements. The pair went past the ascending trend line, but it didn't decline further. The pair constantly rolls back up, corrects, rides on "swings," significantly complicating the trading process. On Wednesday, the dollar fell on information that the market had already known in recent weeks and even before Fed Chairman Jerome Powell's speech. On Thursday, the euro fell, but the uptrend was still preserved.
On Friday, important levels are seen at 1.0762, 1.0806, 1.0868, 1.0926, 1.1068, 1.1137-1.1185, 1.1234, 1.1274, as well as Senkou Span B (1.1007) and Kijun-sen (1.1017) lines. Ichimoku indicator lines can move intraday, which should be taken into account when determining trading signals. There are also support and resistance although no signals are made near these levels. They could be made when the price either breaks or rebounds from these extreme levels. Do not forget to place Stop Loss at the breakeven point when the price goes by 15 pips in the right direction. In case of a false breakout, it could save you from possible losses.
On May 5th, the European Union will release a retail sales report, which is not important. But in the second half of the day, probably the most significant reports of the week will be published – NonFarm Payrolls and unemployment in the United States.
Indicators on charts:
Resistance/support - thick red lines, near which the trend may stop. They do not make trading signals.
Kijun-sen and Senkou Span B are the Ichimoku indicator lines moved to the hourly timeframe from the 4-hour timeframe. They are also strong lines.
Extreme levels are thin red lines, from which the price used to bounce earlier. They can produce trading signals.
Yellow lines are trend lines, trend channels, and any other technical patterns.
Indicator 1 on the COT chart is the size of the net position of each trader category.
Indicator 2 on the COT chart is the size of the net position for the Non-commercial group of traders.
 English
 Русский
 Bahasa Indonesia
 Bahasa Malay
 ไทย
ไทย Español
 Deutsch
 Български
 Français
 Tiếng Việt
 中文
中文 বাংলা
বাংলা हिन्दी
 Čeština
 Українська
 Română

