EUR/USD

Higher timeframes
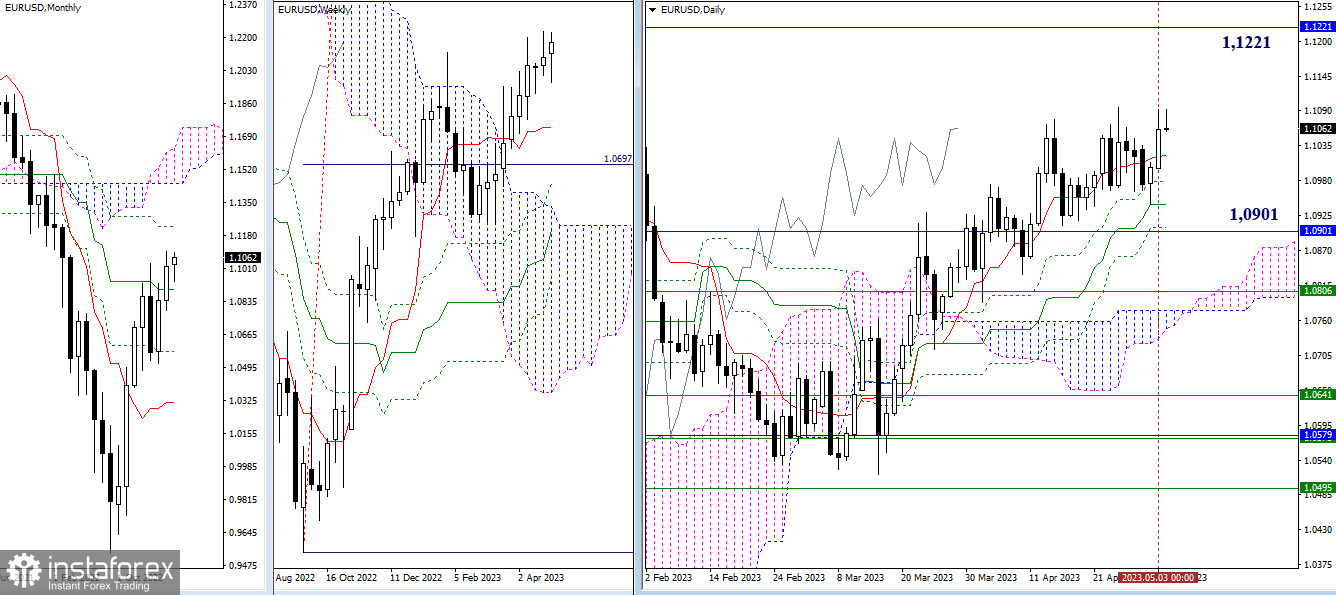
Yesterday, the bulls confirmed the rebound of the previous day, so the tasks mentioned earlier in this direction have not changed. For further strengthening and development of the bullish sentiment, it is necessary to overcome the local high (1.1096) and rise to the final level of the monthly Ichimoku cross (1.1221). In case of changing targets and the return of bearish activity to the market, the support levels of the daily Ichimoku cross (1.1019 – 1.0979 – 1.0942 – 1.0906) will come into play, reinforced by the monthly medium-term trend (1.0901).

H4 – H1
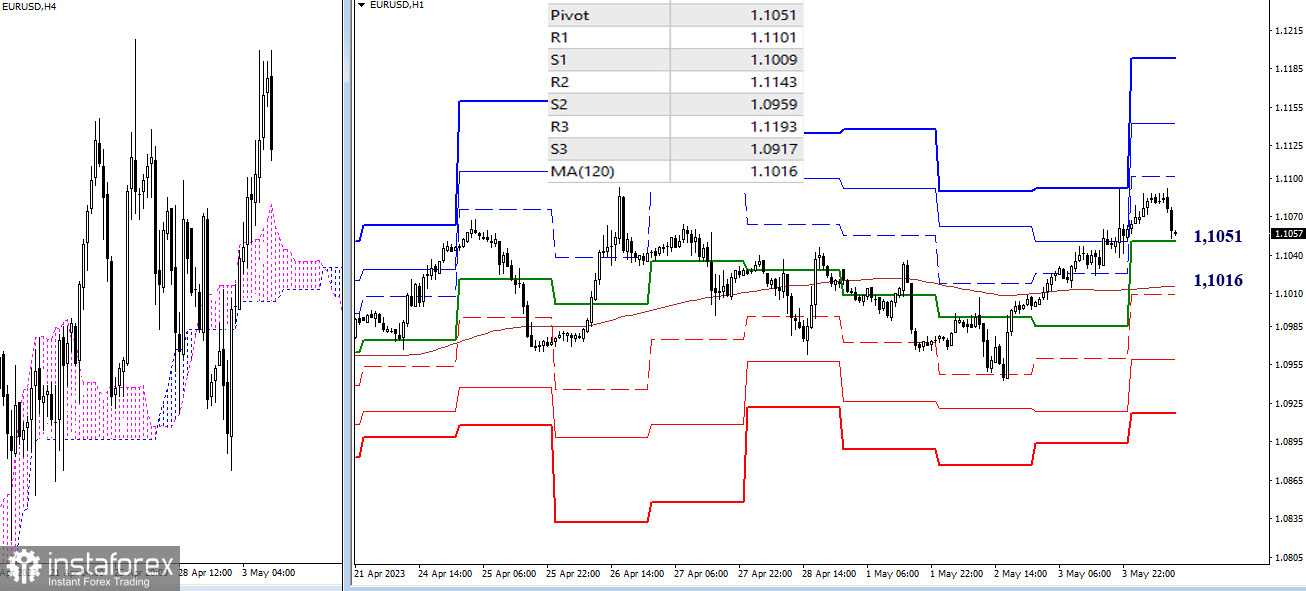
At the moment, there is a corrective decline on the lower timeframes. The pair is currently testing the support of the central pivot point of the day (1.1051). The development of the correction will lead to a key milestone—the weekly long-term trend (1.1016). Breaking these supports can change the current balance of power in favor of the bears. Additional reference points for intraday movement, in addition to the key levels, are the resistances of the classic pivot points (1.1101 – 1.1143 – 1.1193) and support levels (1.1009 – 1.0959 – 1.0917).
GBP/USD

Higher timeframes
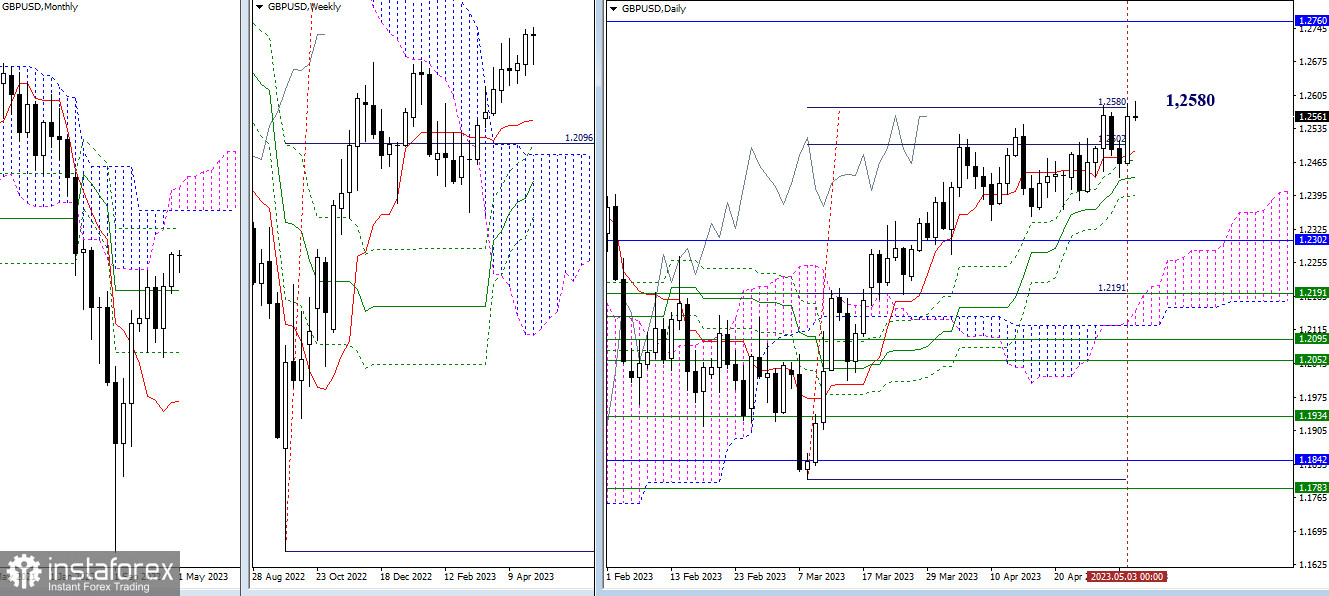
Yesterday, the pound returned again to the 100% completion level of the daily target for breaking the Ichimoku cloud (1.2580). The next upward reference point upon breaking the target is the resistance of the final level of the monthly death cross (1.2760). The closest supports in the current situation are the levels of the daily Ichimoku cross (1.2489 – 1.2470 – 1.2433 – 1.2395). Liquidation of the daily cross will contribute to the formation of a reversal and corrective decline on the higher timeframes.

H4 – H1
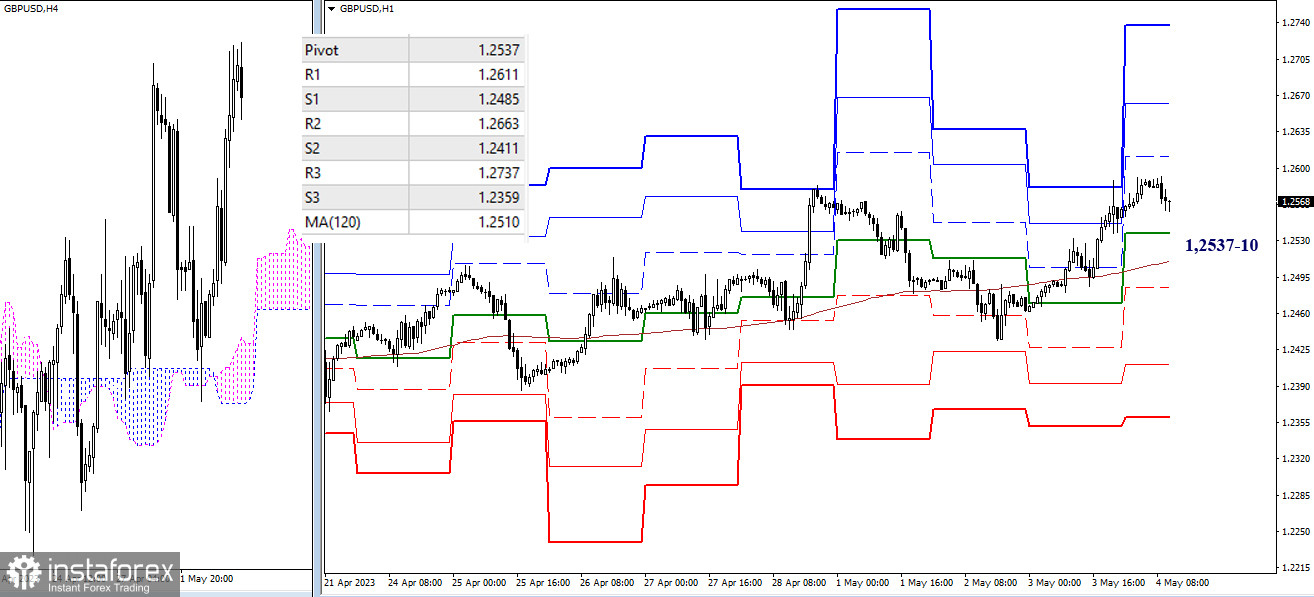
As of writing, the main advantage is on the side of the bulls. The reference points for continuing the ascent within the day are the resistances of the classic pivot points (1.2611 – 1.2663 – 1.2737). If, however, the bears regain their key levels, which are located today in the range of 1.2537-10 (central pivot point of the day + weekly long-term trend), their attention will be focused on the supports of the classic pivot points (1.2485 – 1.2411 – 1.2359).
The technical analysis of the situation uses:
Higher timeframes - Ichimoku Kinko Hyo (9.26.52) + Fibo Kijun levels
Lower timeframes - H1 - Pivot Points (classic) + Moving Average 120 (weekly long-term trend)
 English
 Русский
 Bahasa Indonesia
 Bahasa Malay
 ไทย
ไทย Español
 Deutsch
 Български
 Français
 Tiếng Việt
 中文
中文 বাংলা
বাংলা हिन्दी
 Čeština
 Українська
 Română

