Details of the economic calendar on May 2
According to preliminary data from the European Union's statistical office, inflation in the eurozone reached 7% year-on-year in April, indicating an increase in consumer prices compared to 6.9% in March. This fact may become a significant argument for further tightening of monetary policy at the upcoming European Central Bank meeting on Thursday.
Analysis of trading charts from May 2
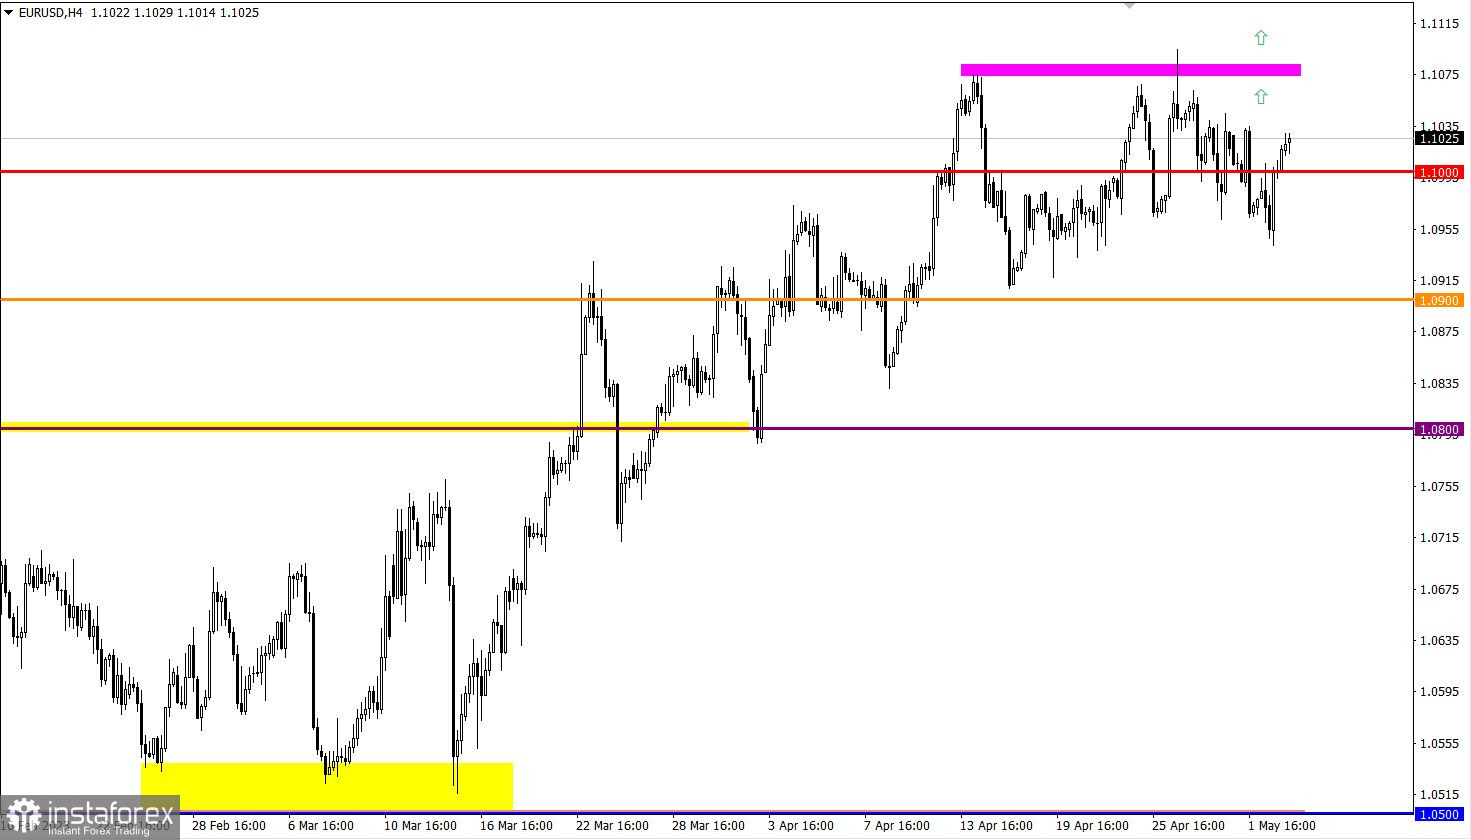
The pullback that occurred a few days ago was more than halfway recovered. EUR/USD began to rise again, but no significant changes have occurred so far.
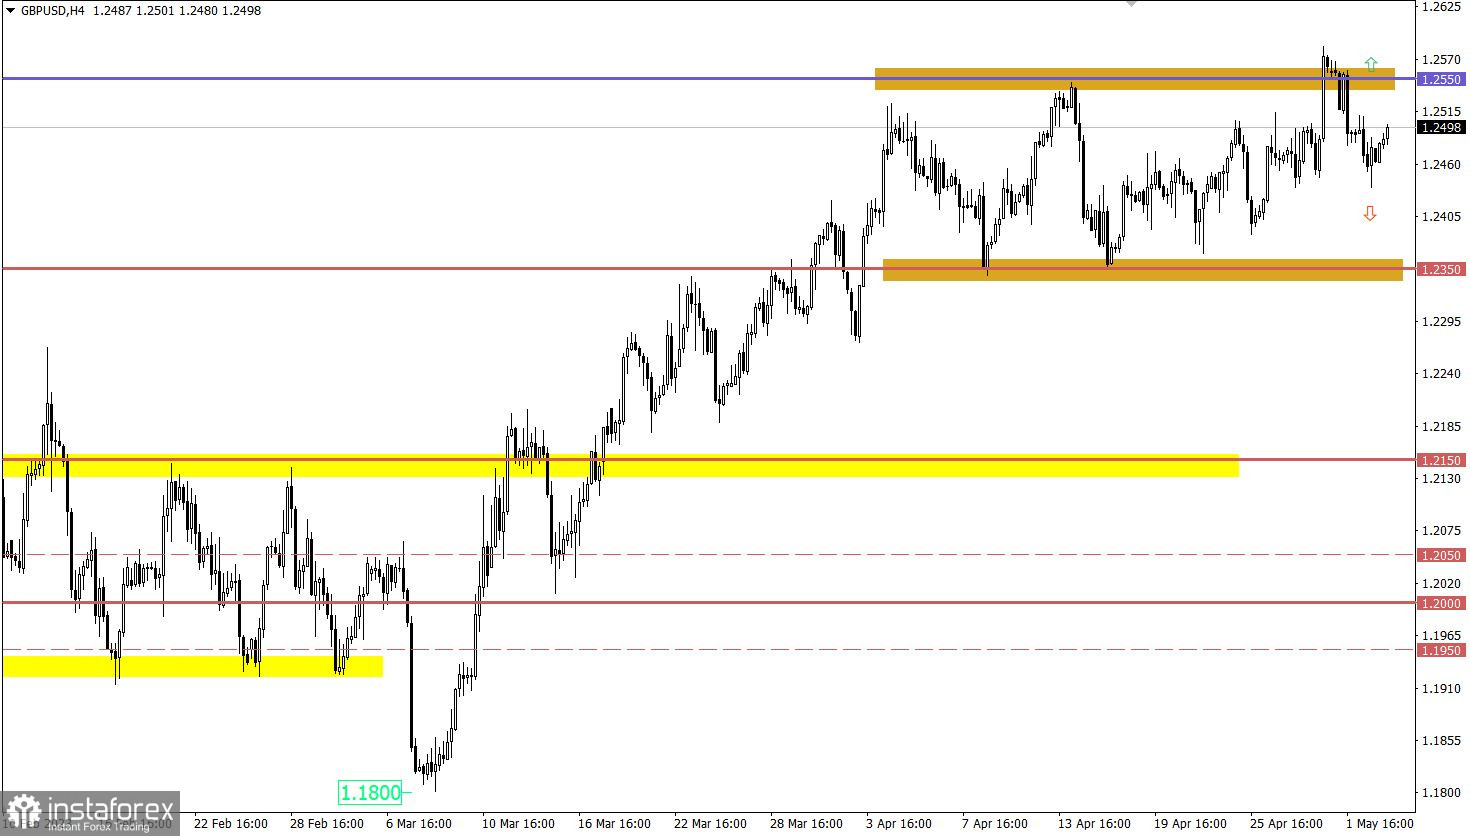
Although GBP/USD fell below the 1.2500 mark during the pullback, this movement did not lead to radical changes. The market still maintains an upward sentiment, as evidenced by the recent update of the local high of the medium-term trend.

Economic Calendar for May 3
Today, the Federal Reserve System is highly likely to raise the key rate by 25 basis points, which will turn out to be a negative factor for financial markets. However, more and more rumors are emerging that the regulator may announce a pause in the tightening cycle. If these rumors are confirmed at the press conference, it could have a strong impact on the U.S. dollar in terms of its sell-off, while the U.S. stock market will move to growth.
Timeline Targeting:
Fed Meeting Results – 18:00 UTC
Fed Press Conference – 18:30 UTC
EUR/USD trading plan for May 3
The first technical signal for the prolongation of the medium-term trend may appear if the price holds above 1.1050. This will allow strengthening long positions in the euro. The main signal for extension will occur after the price holds above 1.1100 during the day.

GBP/USD trading plan for May 3
The first signal for the completion of the pullback stage may appear when the price returns above the 1.2510 level. At the same time, the main technical signal for the growth of long position volumes is expected after the price holds above the 1.2550 level.
Traders consider the downward scenario only within the framework of prolonging the pullback, with the maximum deviation allowed up to the 1.2350 level. Such a scenario will become relevant if the price holds below the 1.2430 level.

What's on the charts
The candlestick chart type is white and black graphic rectangles with lines above and below. With a detailed analysis of each individual candle, you can see its characteristics relative to a particular time frame: opening price, closing price, intraday high and low.
Horizontal levels are price coordinates, relative to which a price may stop or reverse its trajectory. In the market, these levels are called support and resistance.
Circles and rectangles are highlighted examples where the price reversed in history. This color highlighting indicates horizontal lines that may put pressure on the asset's price in the future.
The up/down arrows are landmarks of the possible price direction in the future.
 English
 Русский
 Bahasa Indonesia
 Bahasa Malay
 ไทย
ไทย Español
 Deutsch
 Български
 Français
 Tiếng Việt
 中文
中文 বাংলা
বাংলা हिन्दी
 Čeština
 Українська
 Română

