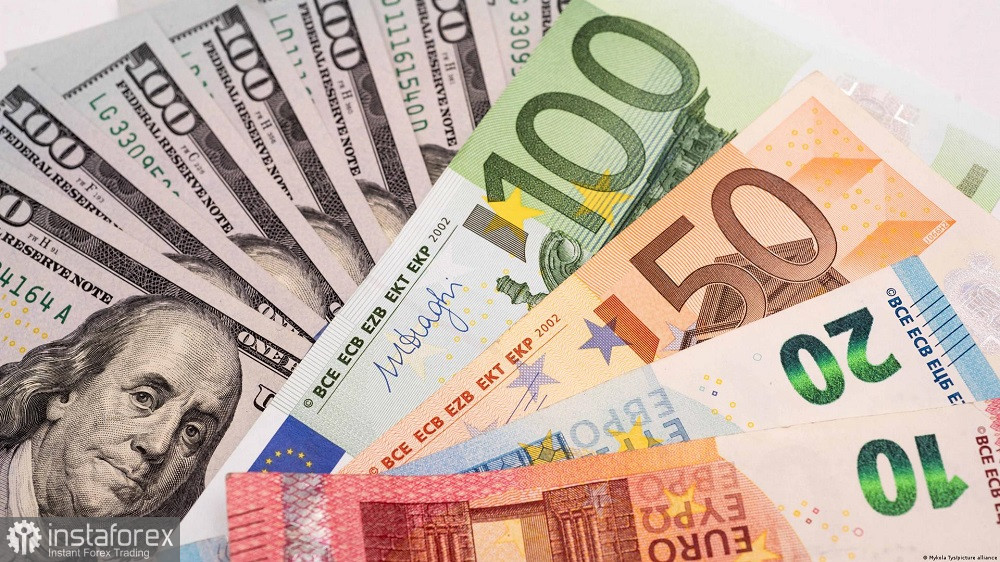
On Tuesday, the EUR/USD pair showed contradictory dynamics ahead of the release of important macroeconomic reports. Against the background of an almost empty economic calendar on Tuesday, the pair initially updated a one-and-a-half-week high (reaching the 1.1068 mark), and then turned back south. Traders are trying to approach the 1.1100 mark, but each conquered point was quite challenging for the bulls, and each ascending wave is followed by a bearish pullback. One step forward, one step back. Nevertheless, traders were able to test the resistance level of 1.1030, which corresponds to the upper line of the Bollinger Bands indicator on the daily chart. It was not possible to consolidate above this target: bears intercepted the initiative, extinguishing another rally.
Arguments against the greenback
Overall, the fundamental background is not in favor of the US currency. Last week, the greenback lost an important advantage in the form of rising Treasury yields. The yield on 10-year government bonds reached its local peak of 3.609 (monthly high) on April 17, after which the indicator made a 180-degree turn. The sharp decline in US Treasury bond yields has strongly weighed on the dollar. The yield on basic 10-year bonds lost more than 2% and dropped below 3.5% - for the first time since April 14.
However, last week, the greenback strengthened its positions not only due to the growth in Treasury yields. The hawkish stance of the US central bank is the main locomotive of the revaluation of the US currency. But this fundamental factor is gradually melting away, making it possible for the bulls to gradually expand their price territories.

According to data from the CME FedWatch Tool, there is currently a 85% probability of a 25 basis point rate hike next month. The market is almost certain that the central bank will raise the rate to 5.25% at the May meeting. At the same time, traders are confident that the Federal Reserve will take a wait-and-see approach at subsequent meetings (for example, the probability of remaining unchanged in June is almost 70%). In particular, Wells Fargo analysts in their latest review pointed out that the Fed is likely to indicate next month that the May rate hike is the last in this tightening cycle.
As we can see, hawkish statements from some Fed representatives (in particular, Waller and Bullard) have not convinced market participants. In my opinion, traders have come to a reasoned and quite logical conclusion that the Fed will perform the "last chord" in May.
Event horizon
Any forecasts regarding the Fed's further steps (in June, July, and beyond) are "guesses" because between the May and June meetings, the central bank will receive two employment reports, key inflation reports (CPI, PCE), and one retail sales report.
In addition, the Fed will be assessing the side effects of raising the rate. Recall that the ISM Manufacturing Index in March plummeted to 46.3 with an estimated decline to 47.5 – the weakest result since May 2020. The ISM Services Index also entered the "red" zone. The number of building permits issued in the US fell sharply by 8.8%. The gloomy picture was completed by the volume of existing home sales, which fell by 2.4% in March (the weakest result since November 2022).
If key macroeconomic indicators continue to reflect negative trends (amid slowing inflation), the stance of Fed representatives (even the most staunch hawks) will noticeably soften. Therefore, the market is quite skeptical about the current verbal signals. Moreover, according to some experts, if the US economy enters a recession in the second half of the year, the Fed may lower the interest rate. Such rumors put background pressure on the greenback and certainly do not contribute to the development of a downtrend for the EUR/USD pair.
Conclusions
Bearish correctional declines should be treated with great caution. On Thursday and Friday, important macroeconomic reports will be published (US GDP, core PCE index, German inflation), which will affect the dollar and the EUR/USD pair in particular. According to the majority of experts' forecasts, the US economy will grow by 2.0% in the first quarter, indicating a downtrend. The GDP price index, which measures the annual change in the prices of goods and services included in GDP, is also expected to show a downward dynamic, reaching a 3.8% mark. If the release turns out to be in the "red", the dollar will be under strong pressure.
From a technical point of view, on the daily chart, the pair is between the middle and upper lines of the Bollinger Bands indicator, as well as above all the lines of the Ichimoku indicator (including the Kumo cloud). This combination points to an upward movement. However, it is better to consider long positions once the pair has consolidated above the resistance level of 1.1030 (the upper line of the Bollinger Bands indicator). The next price barrier (the target of the bullish movement) is the 1.1100 mark. The nearest support level is the 1.0990 target, but the bearish correctional pullback may be more extensive - down to the 1.0940 mark (the middle line of the Bollinger Bands on the same chart).
 English
 Русский
 Bahasa Indonesia
 Bahasa Malay
 ไทย
ไทย Español
 Deutsch
 Български
 Français
 Tiếng Việt
 中文
中文 বাংলা
বাংলা हिन्दी
 Čeština
 Українська
 Română

